Strange Attractors
-
Dates2021 - 2021
-
Author
- Topics Contemporary Issues, Fine Art
- Location Mumbai, India
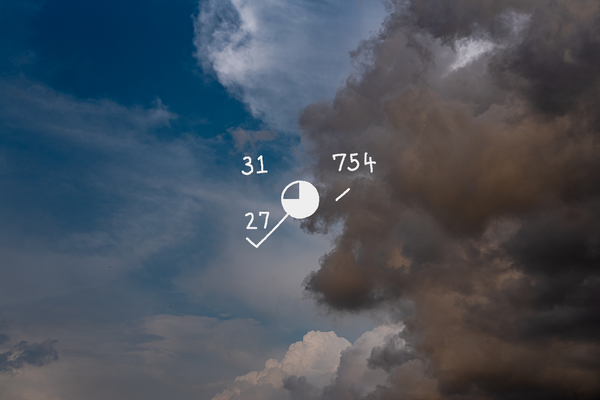
An exploration of the dynamic nature of the atmosphere, Weather Report is a typological project that uses the station model method to depict weather conditions over Mumbai during the monsoon season.
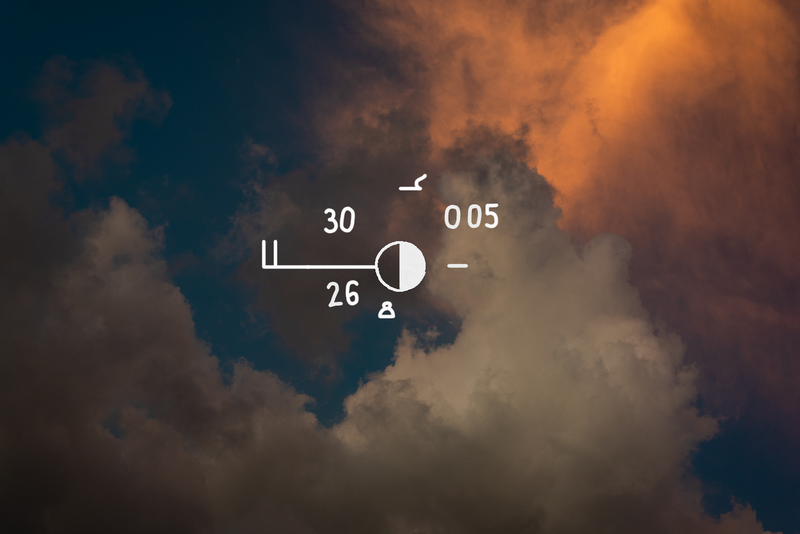
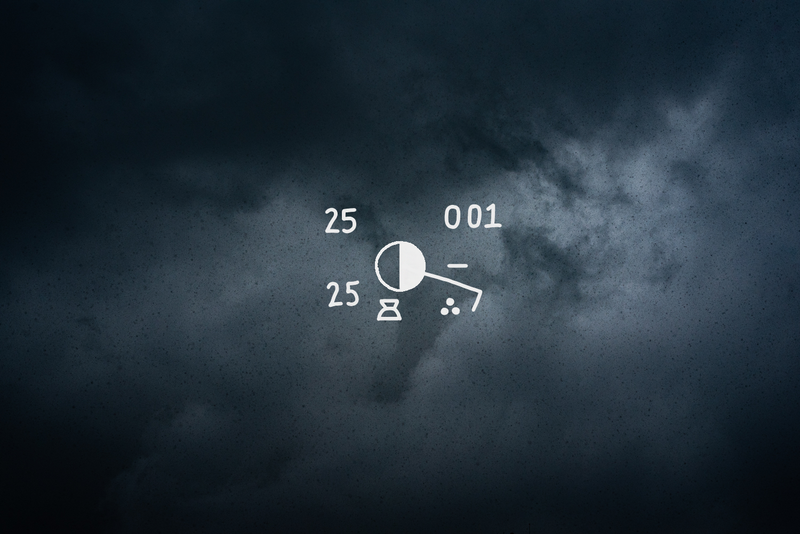
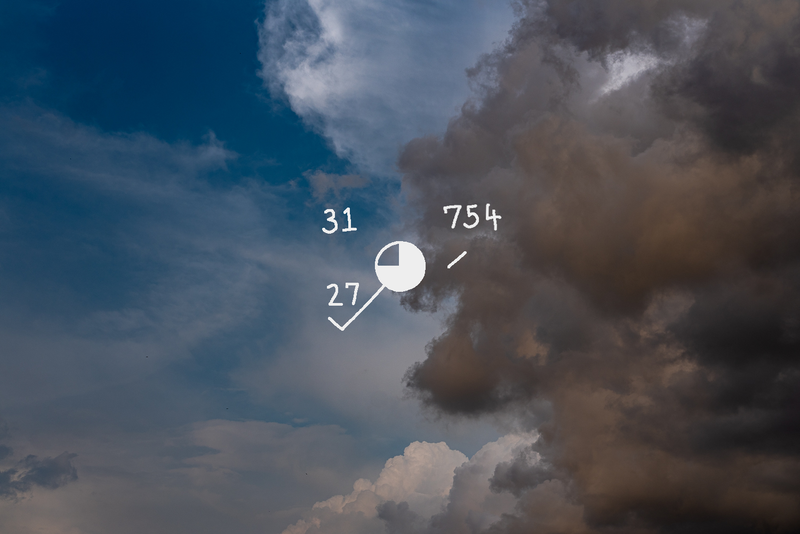
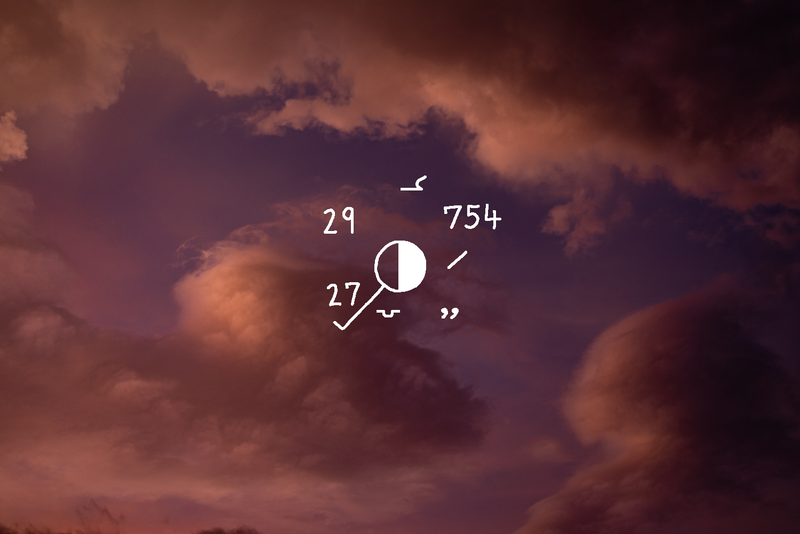
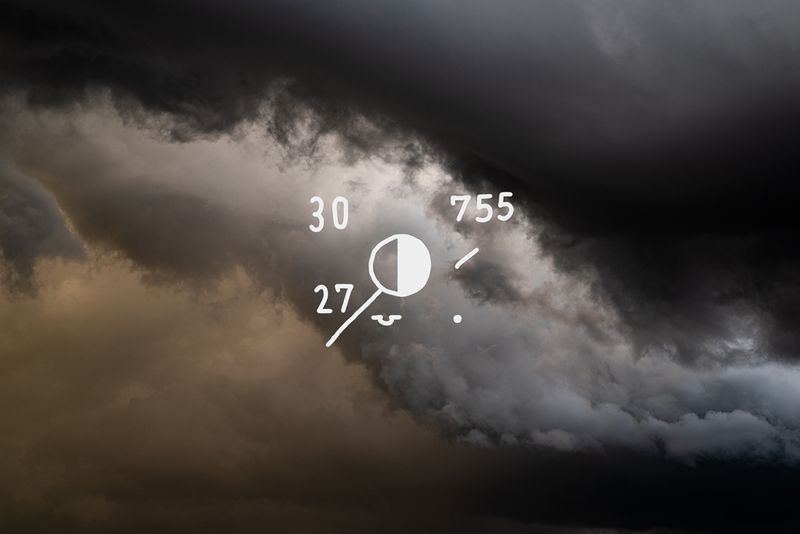
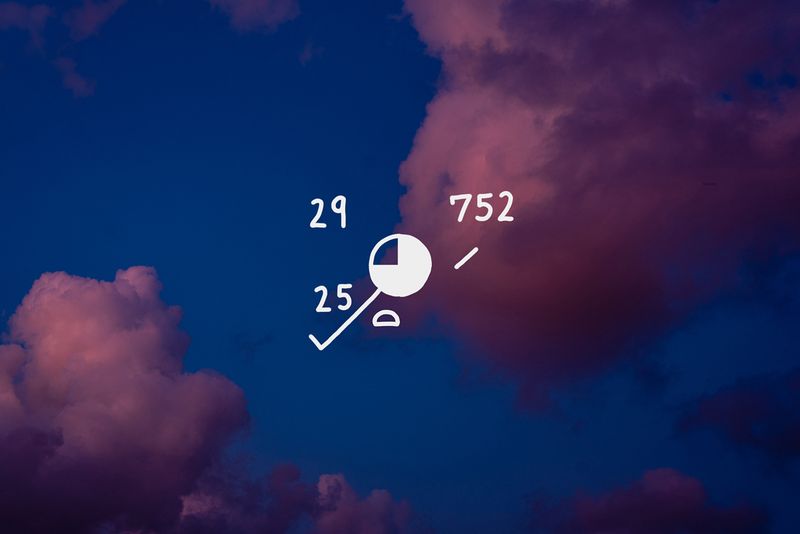
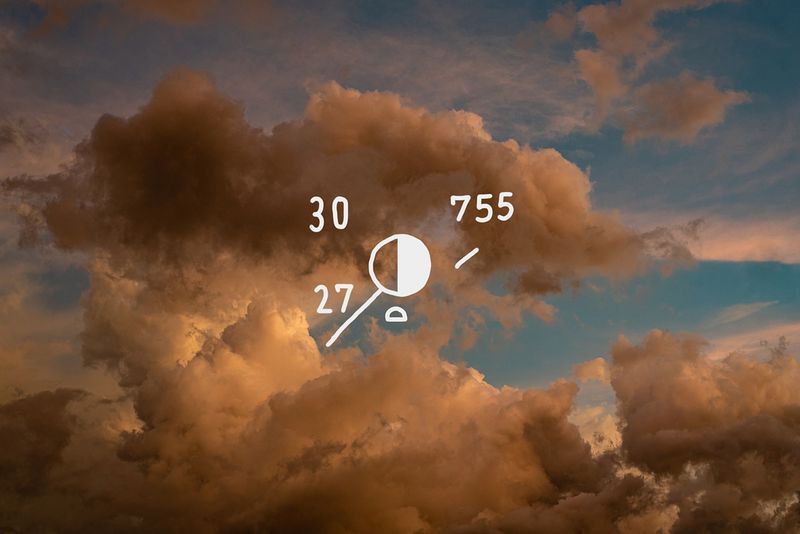
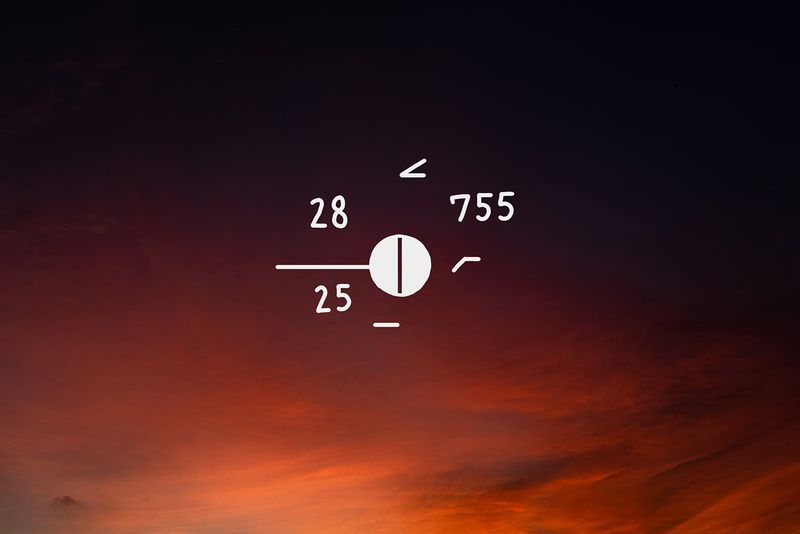
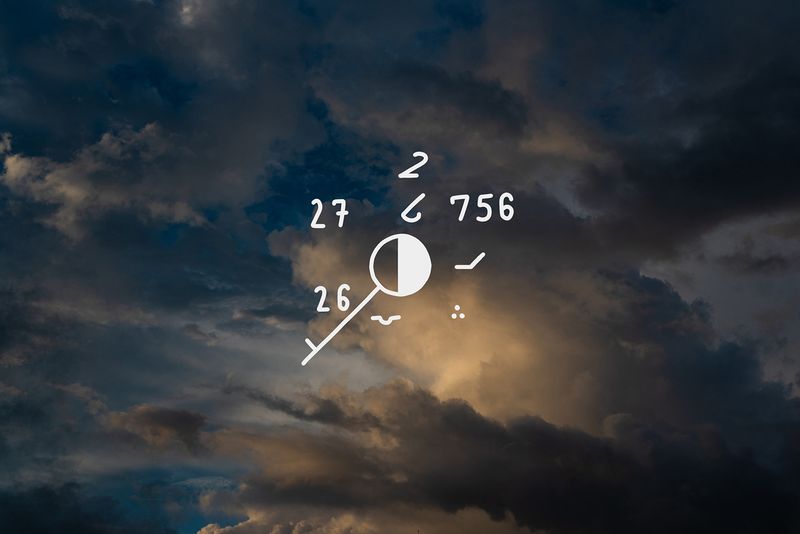
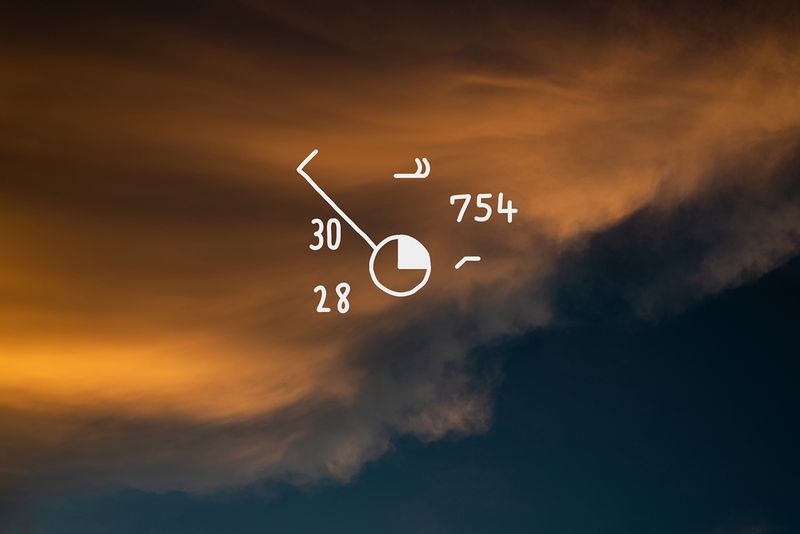
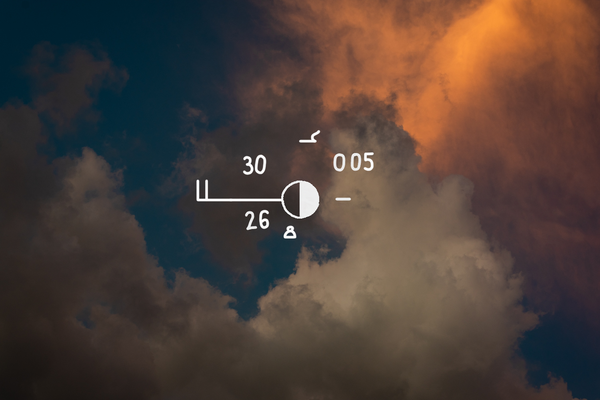
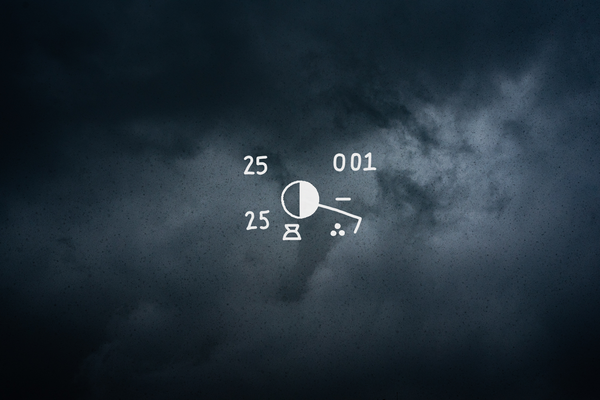
A study of atmospheric science variables; Strange Attractors is a photo, video and data based exploration of the dynamic nature of the monsoon skies above Mumbai. Using the station model method (a meteorological data visualisation technique that depicts current weather conditions over a given location), this typological body of work links real time data with visuals in an attempt to track shifts in climate and weather at this critical time of Anthropocene - a geological period of time defined by human impact on the planet.
Mumbai recorded over 3000mm of rainfall in the monsoon months of June-September in 2021, which is 30.27% above the seasonal average of 2205mm.
Three extremely heavy rainfall days were reported through the season with there being a great variability in rainfall distribution throughout the season. June 2021 was the third wettest recorded while the maximum amount of rain fell in July, partly due to two extremely severe storms which developed very rapidly and flooded the city in a short amount of time. The month of August was the sixth driest since 1901 while September ended up being the tenth wettest since 1901.
This varying pattern of rainfall - short bursts of intense rainfall followed by long, dry spells is increasingly being recognised the world over as a time signature of a rapidly changing climate.
KEY:
The circle in the center depicts the percentage of sky that is covered by clouds while the long line with spokes joining the circle depicts wind direction and speed in knots.
Left of the circle, actual temperature is depicted on top while the dew point temperature is depicted below. On the right, the three digit number represents barometric pressure while the short line just below it depicts barometric pressure trends in the three hours preceding the reading.
Lastly, the symbols above and below the circle depict types of high, middle and low altitude clouds while the symbols on the bottom-right depict the type of precipitation in the past six hours.