Melting Point

-
Dates2019 - Ongoing
-
Author
- Locations Germany, Norway, Greenland
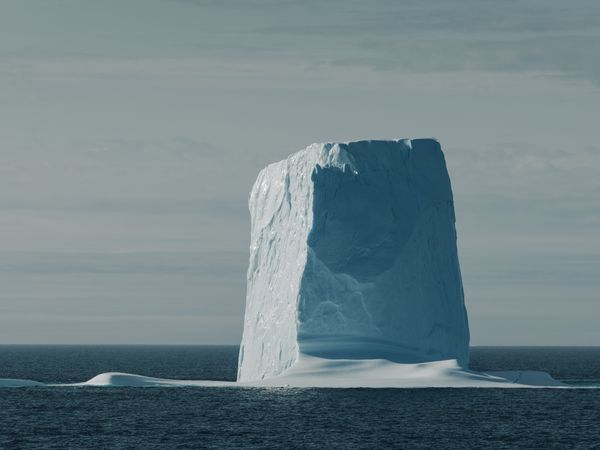
In June of 2019 the danish climate scientist Steffen Olsen twittert a photo from his expedition in northern Greenland. The picture showed his sled dogs running ankle-deep through freshly melted water on an ice sheet. The picture went viral and served as example for the acceleration for the impact of climate change in the arctic, a region that suffers more than others from rising global temperatures. A collapse oft the Greenland ice sheet could lead to a massive rise in global sea levels.
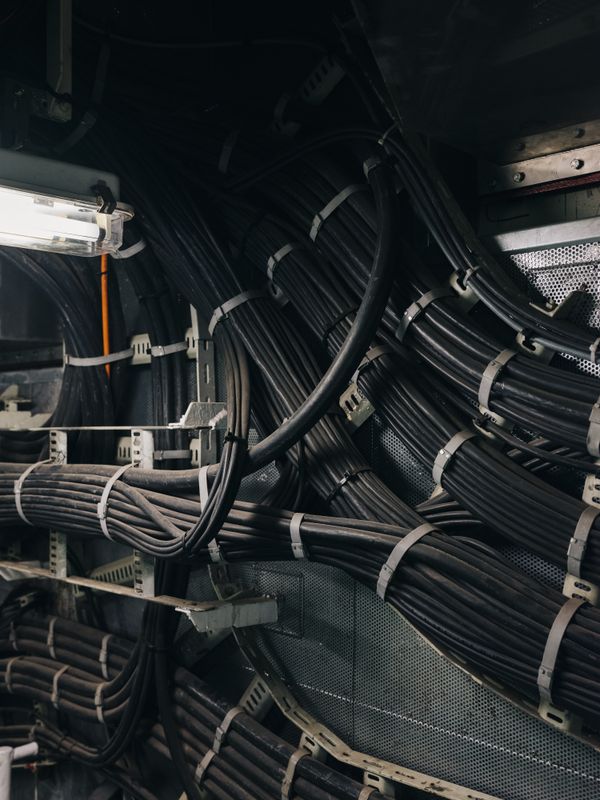
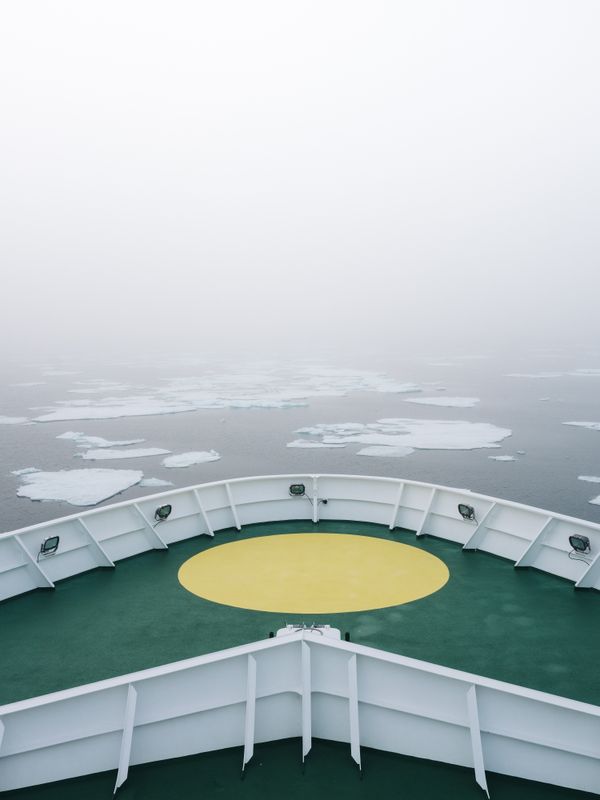
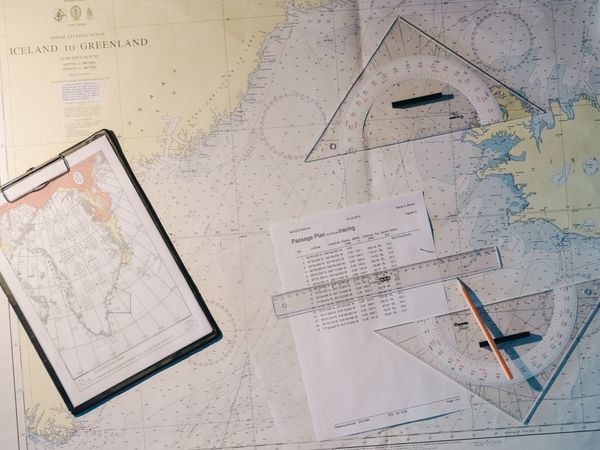
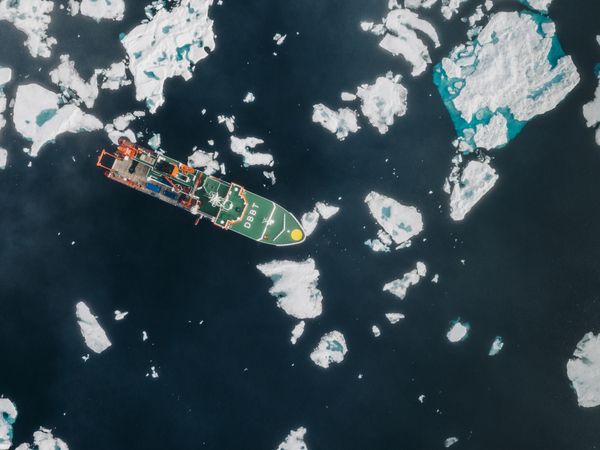
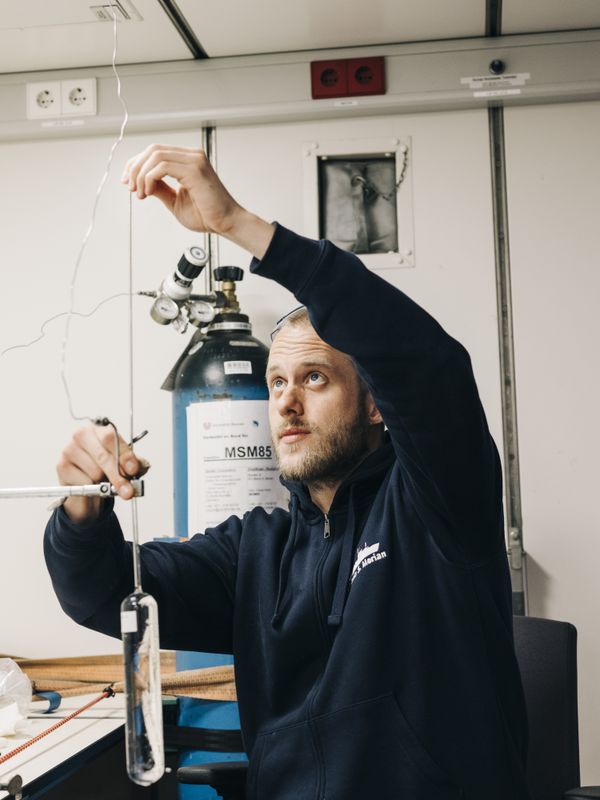
Warmer sea water in the region also leads to the thawing and the erosion of costal glaciers that are melting from the bottom. In July of 2019 a group oceanographers left the harbor of St. John’s in Canada to examine how much sea water leaves the fjords in Greenland and enters into the East Greenland Current (EGC). The EGC is part of the global thermohaline circulation, a change in its constitution could have severe effects on the global water circulation including the Gulf Stream that brings a moderate climate to Europe.
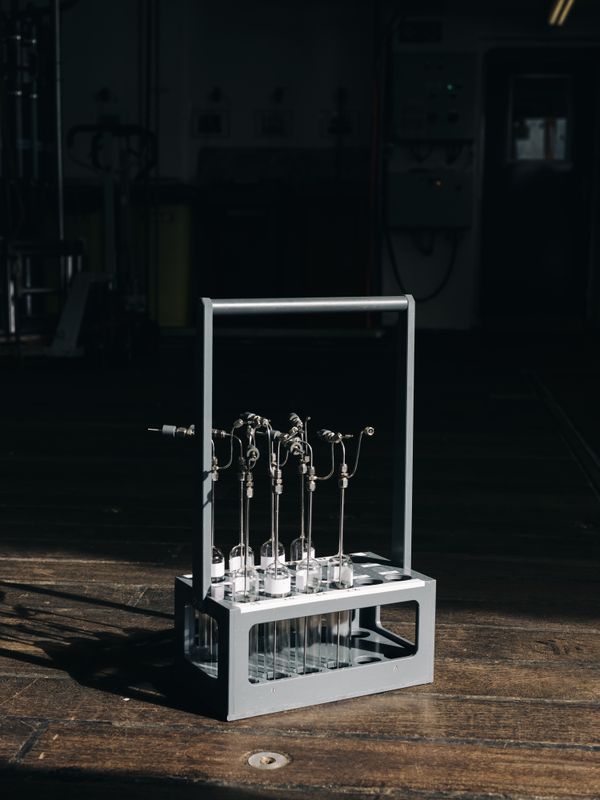
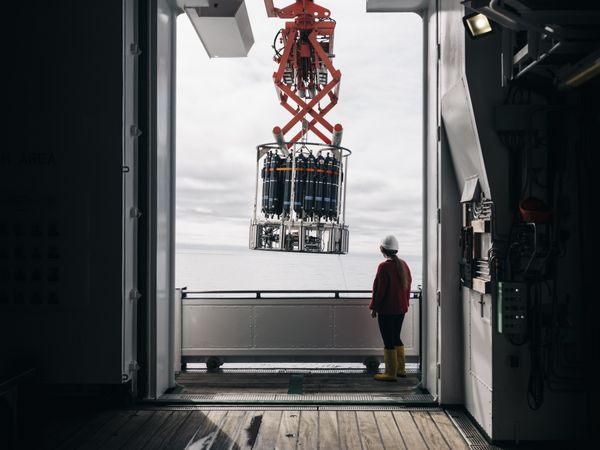
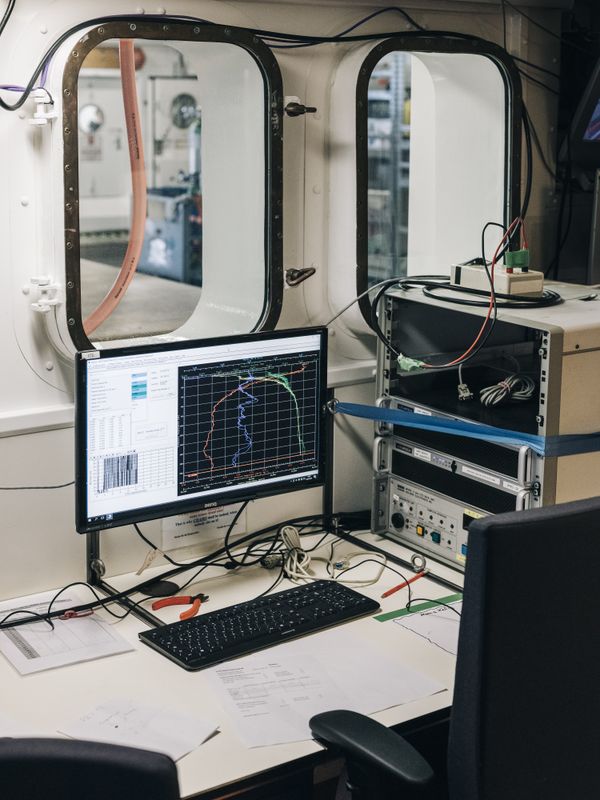
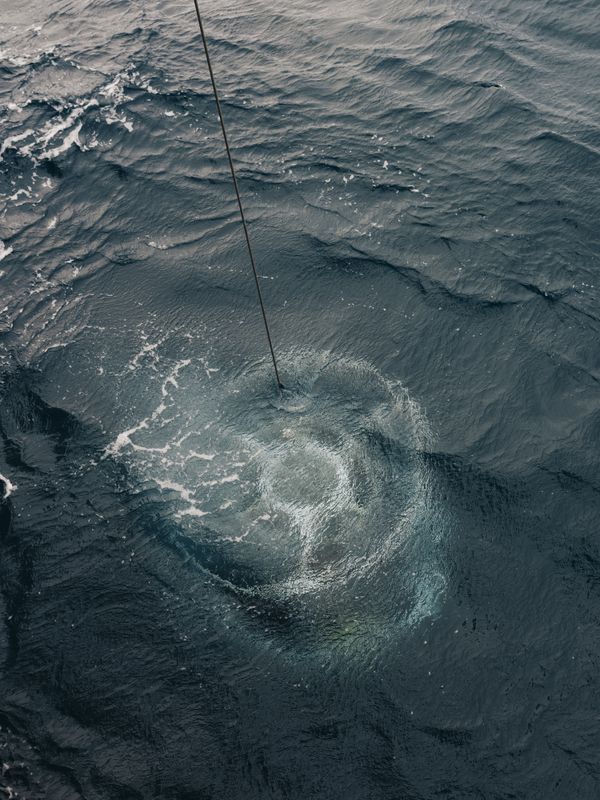
Aim of the research was to follow the EGC along the whole coast of eastern Greenland to determine how much is actually ice melting in the arctic and to give a prediction on how this will impacts global sea levels in the future. The scientists took hundreds of water samples on 170 stations along the way, the analysis will take months.
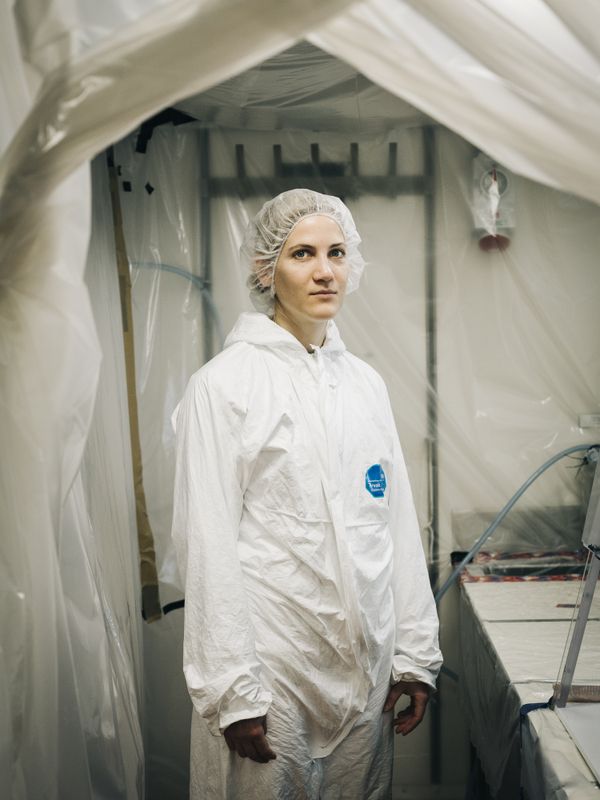
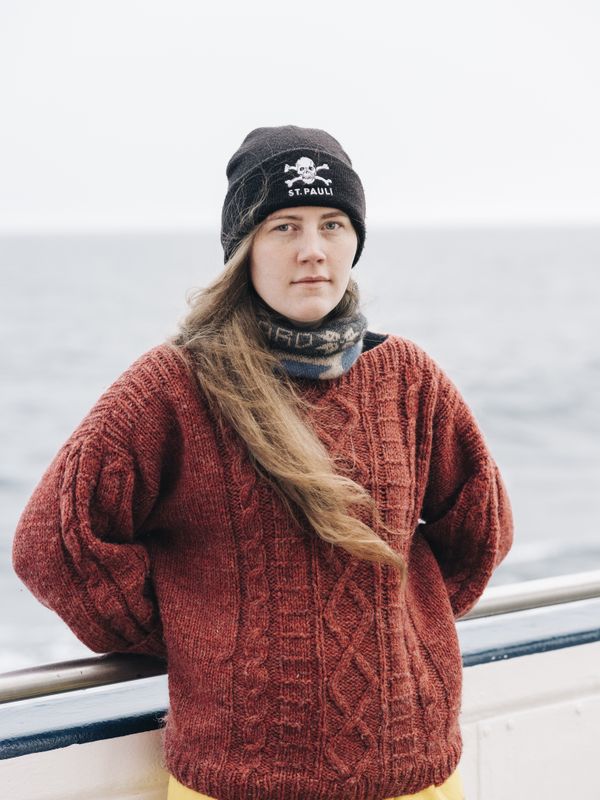
Following the scientists on their journey of collecting samples and data was the first step in my ongoing project. Most of the evaluation und analysis is done in the laboratories back at home. The work they do there, hidden away from the public eye, largely contributes to our understanding of the world. The aim of the project is to follow scientists working on climate releated topics and give them the space and the attention that they deserve in times of public climate change denial.