Counting the Costs
By Dillon Marsh
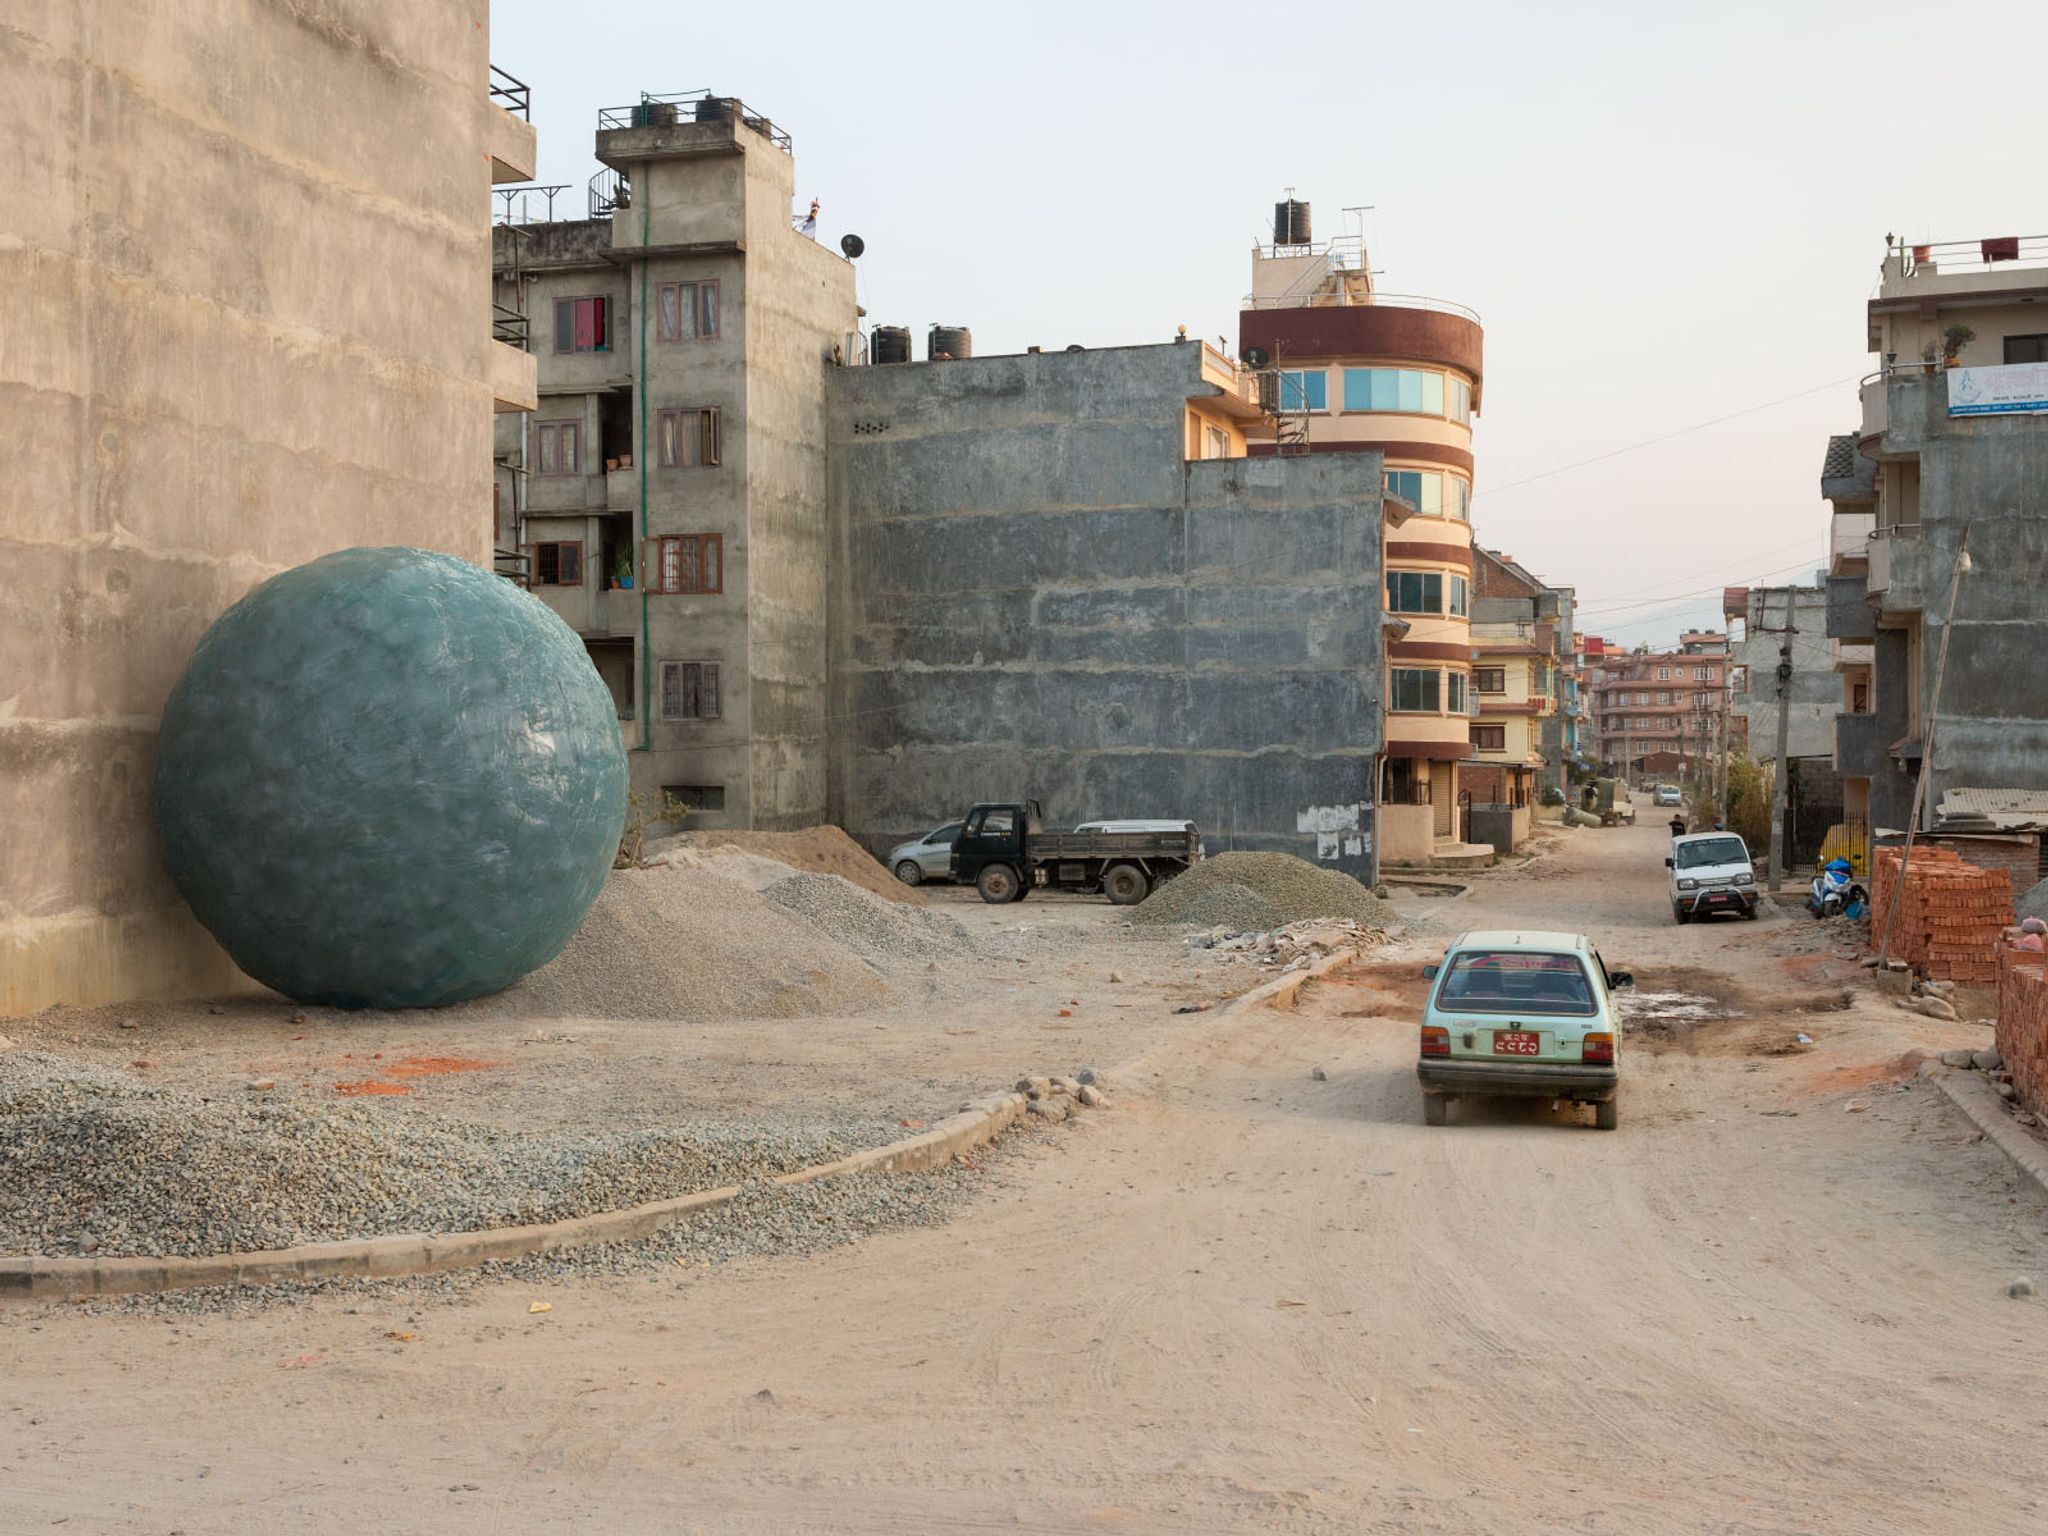
Earth is in the grip of an unprecedented warming trend and there is little doubt that greenhouse gas emissions are the primary cause. We are making the planet hotter, and the effects of this can be clearly seen in the rapidly shrinking glaciers worldwide.
These images combine photography and computer generated elements in an effort to present a new way of visualising the loss of glacial ice. I’ve compiled data from scientific reports to calculate the rate at which certain glaciers are losing mass. Using CGI, I’ve then created accurately scaled ice models and placed them within typical human environments. By doing so, the aim is to draw attention to the dramatic climate changes that continue unabated while we go about our day-to-day lives.
I plan to eventually make this a global project and I hope to include glaciers from all around world. This first instalment focusses specifically on glaciers found in India and Nepal, home to some of the highest mountains in the world.
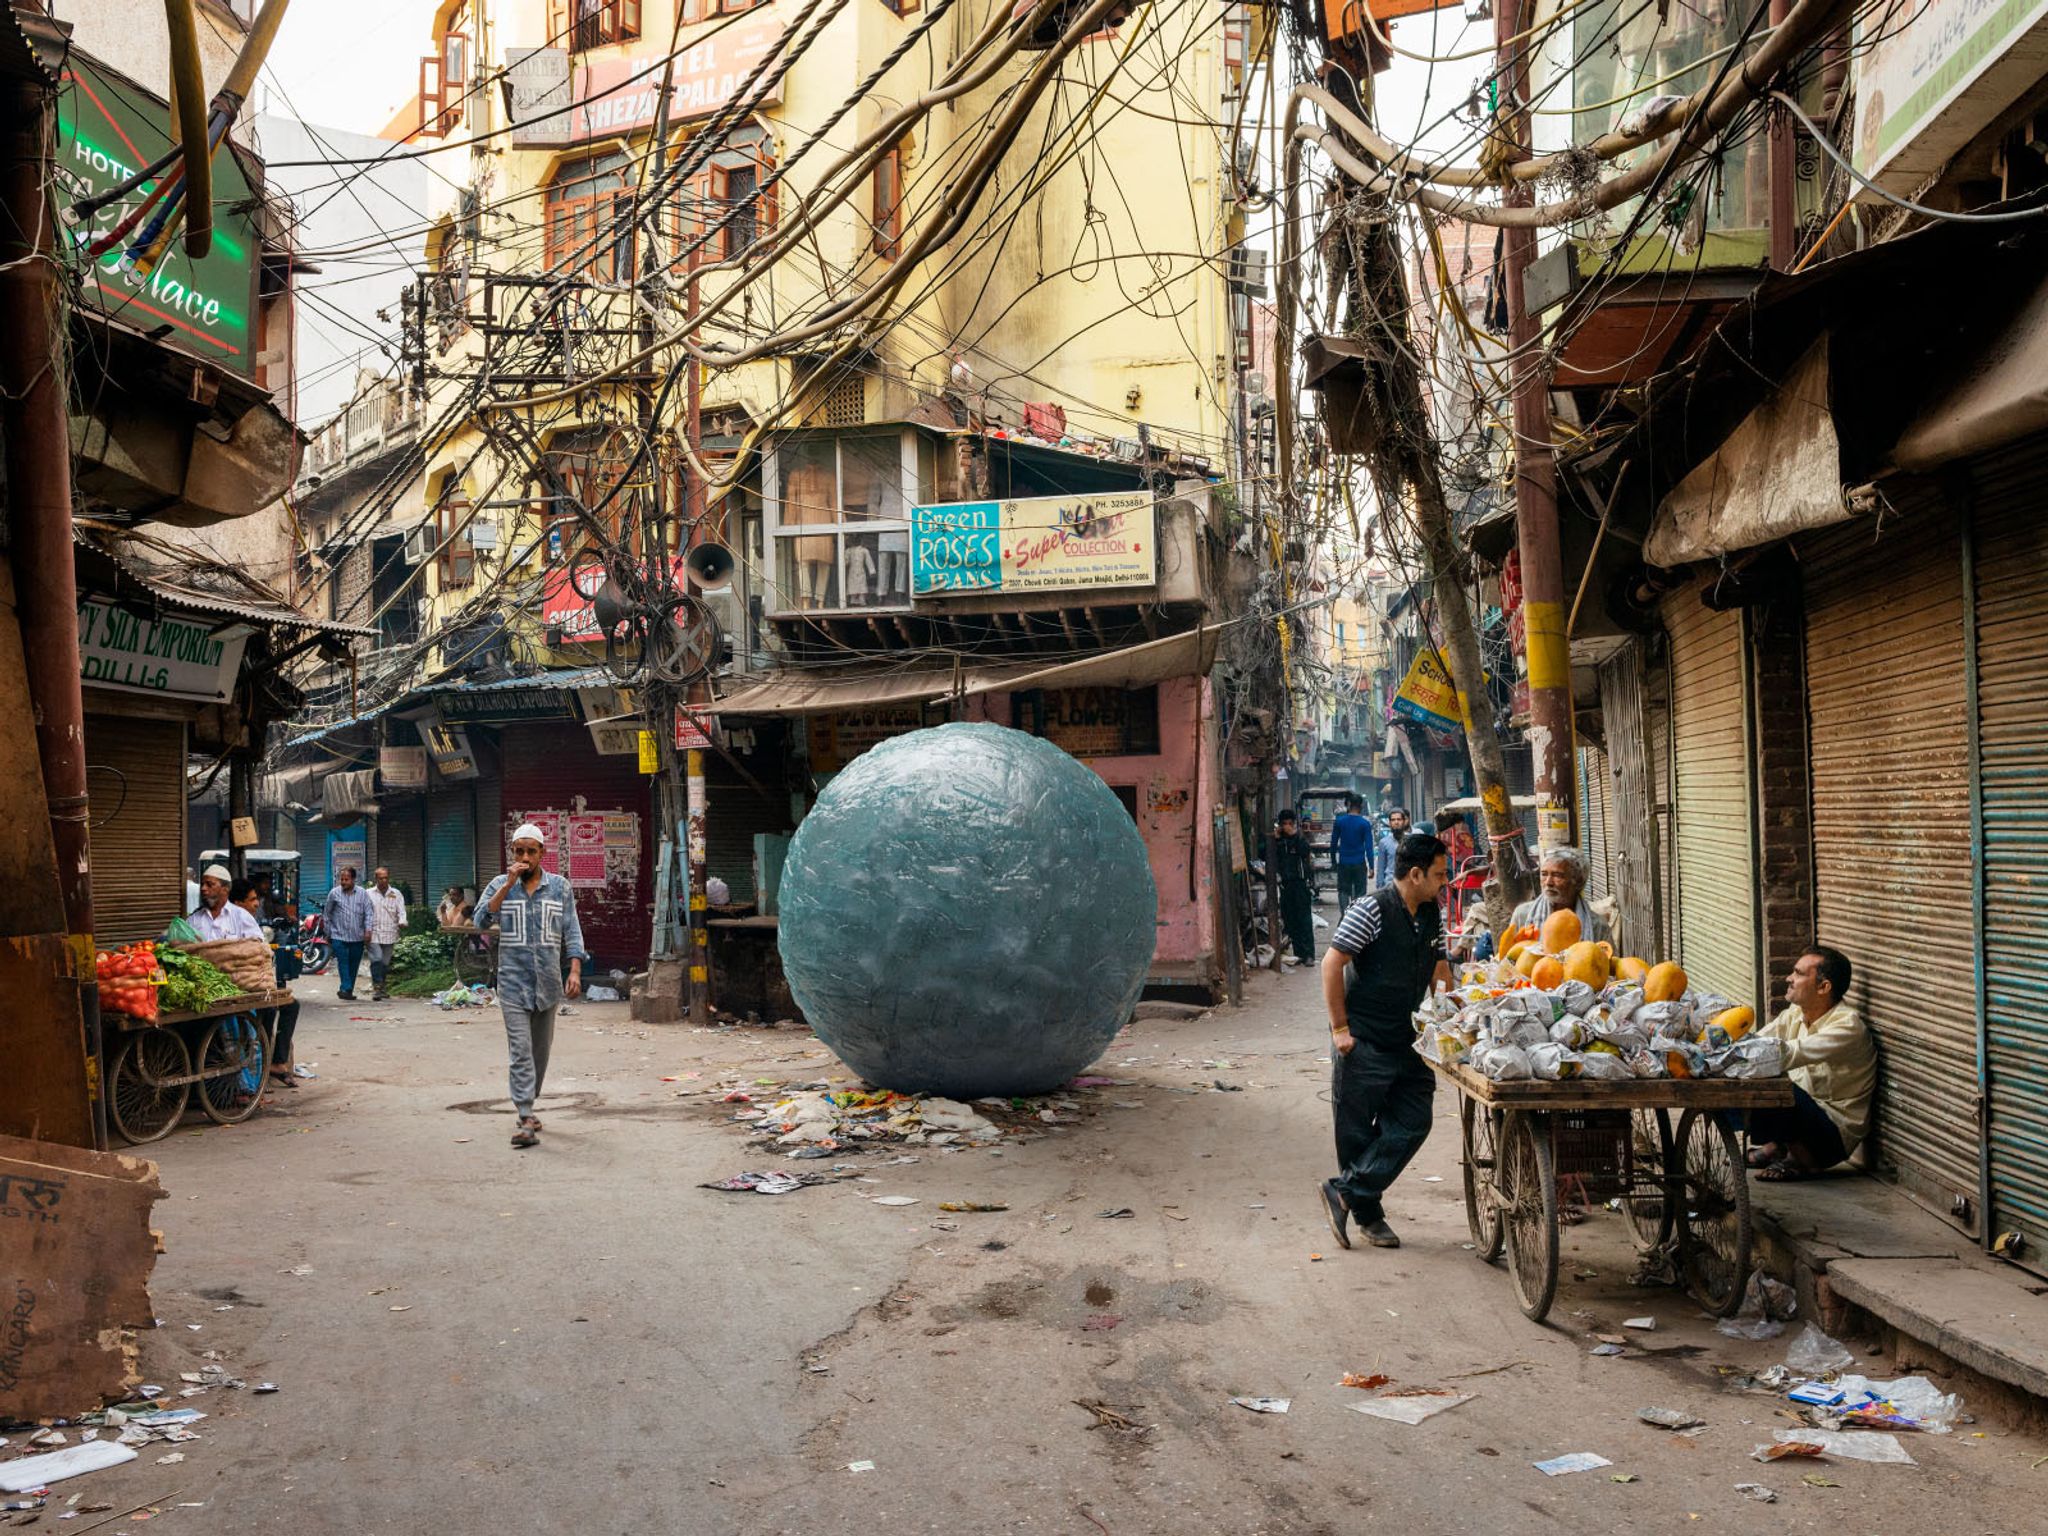
7.06 cubic meters – the average volume of ice lost on Naradu glacier every minute

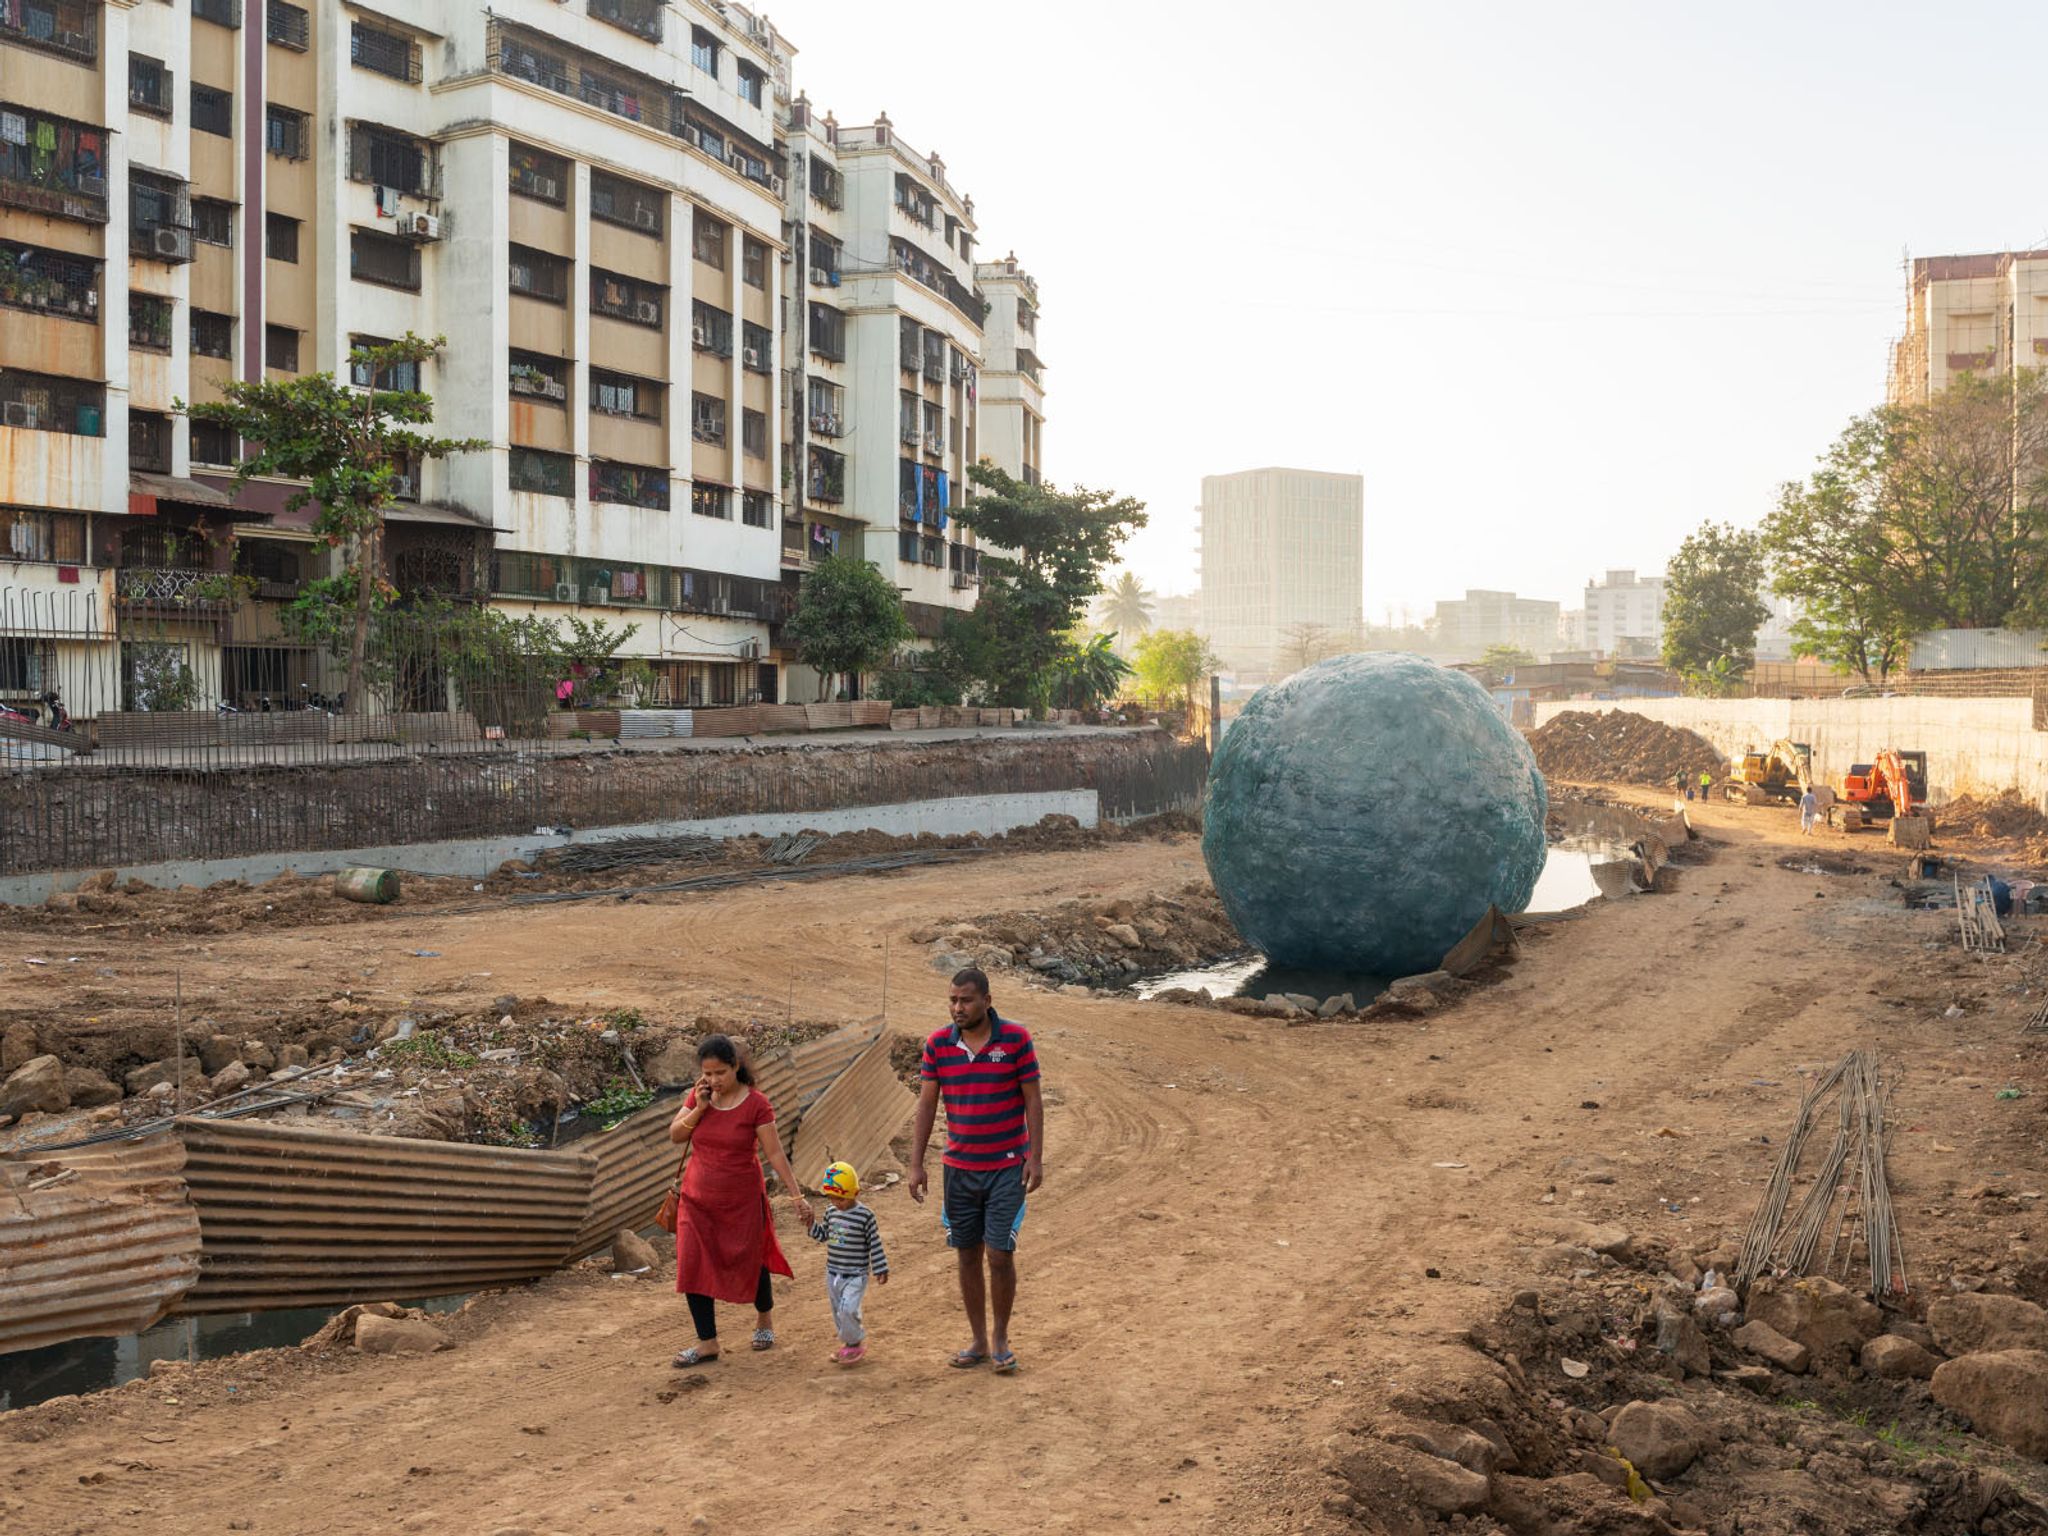
18.64 cubic meters – the average volume of ice lost on Chhota Shigri glacier every minute
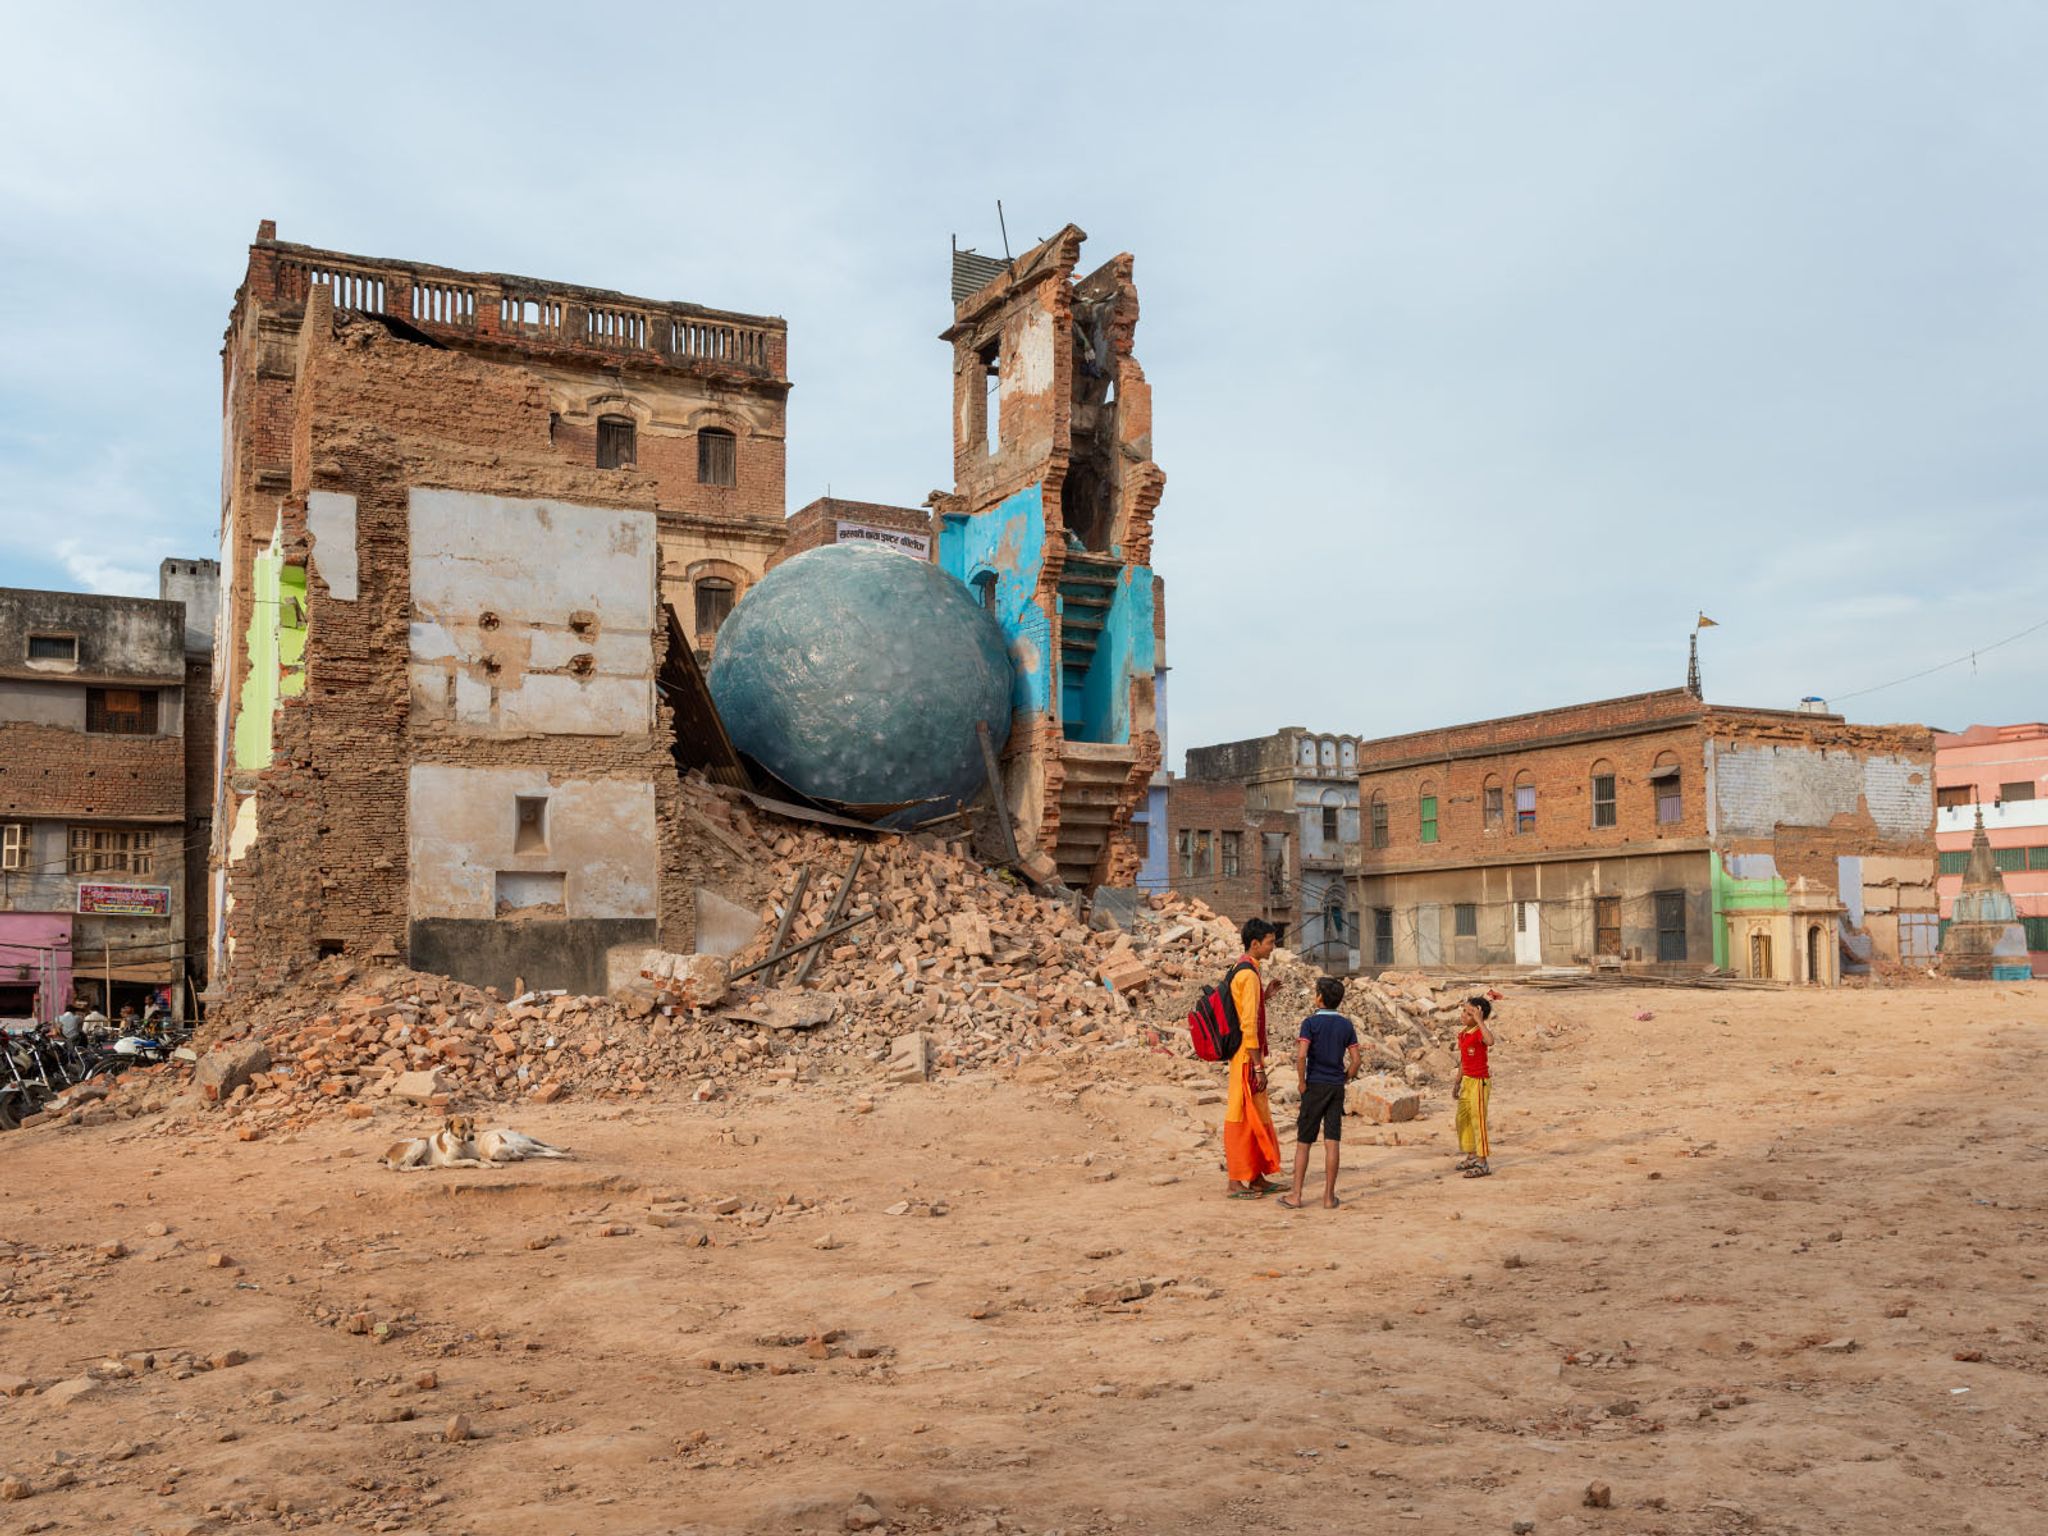
92.58 cubic meters – the average volume of ice lost on Neh Nar glacier every hour
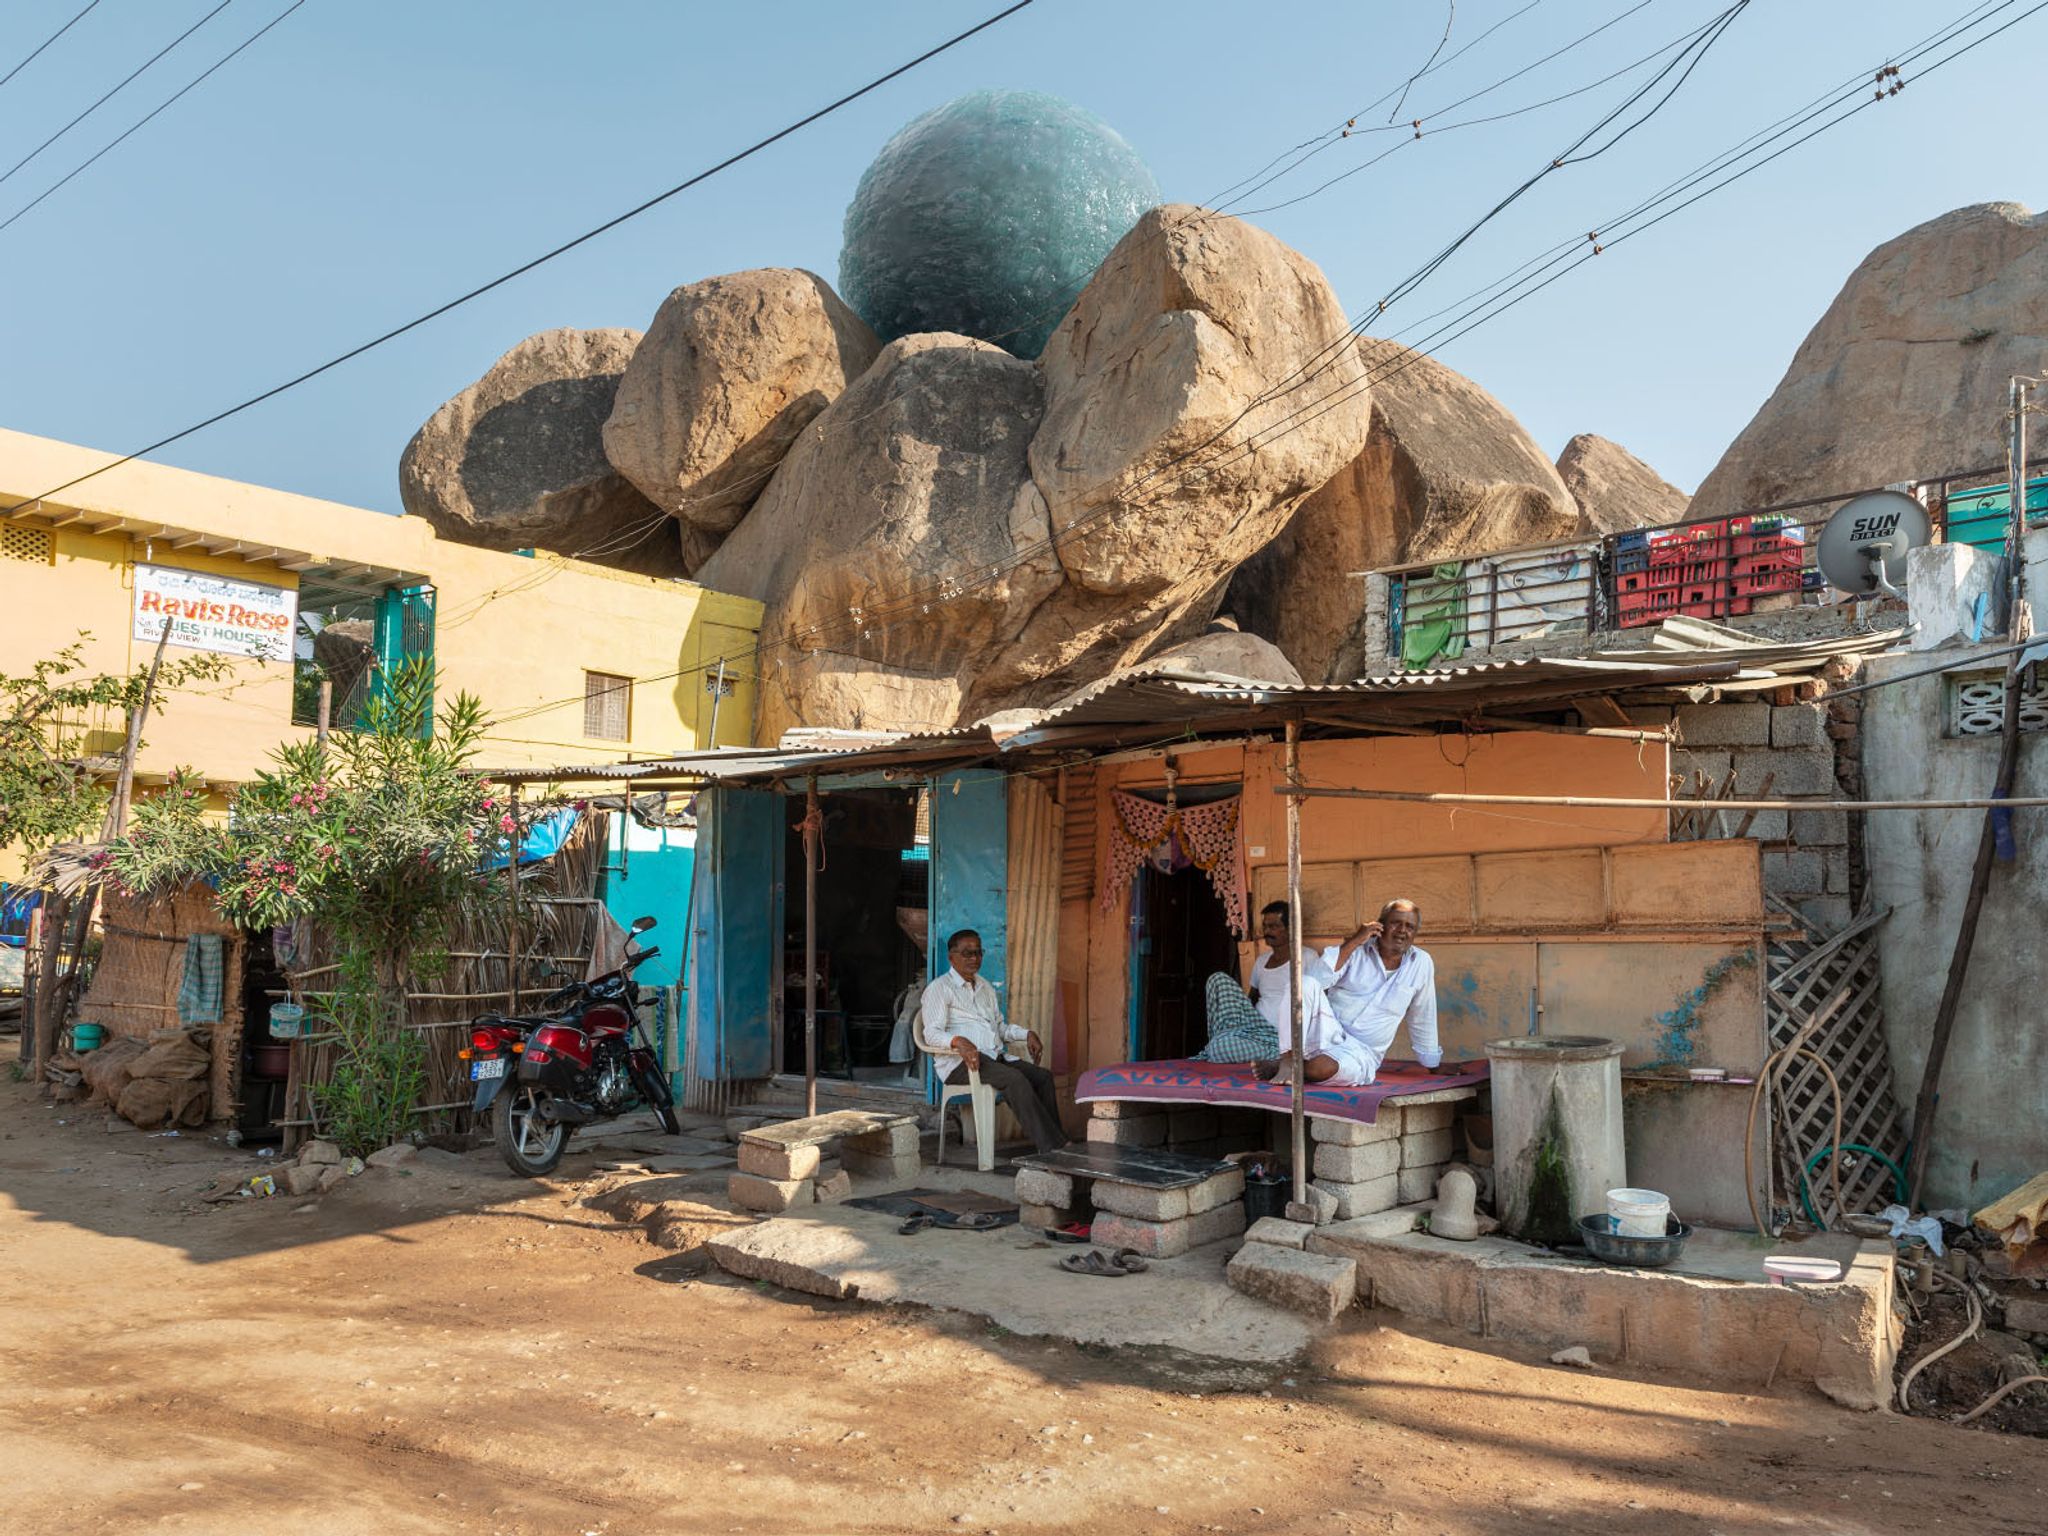
62.15 cubic meters – the average volume of ice lost on Tipra Bank glacier every half hour
176.6 cubic meters – the average volume of ice lost on Gara glacier every hour
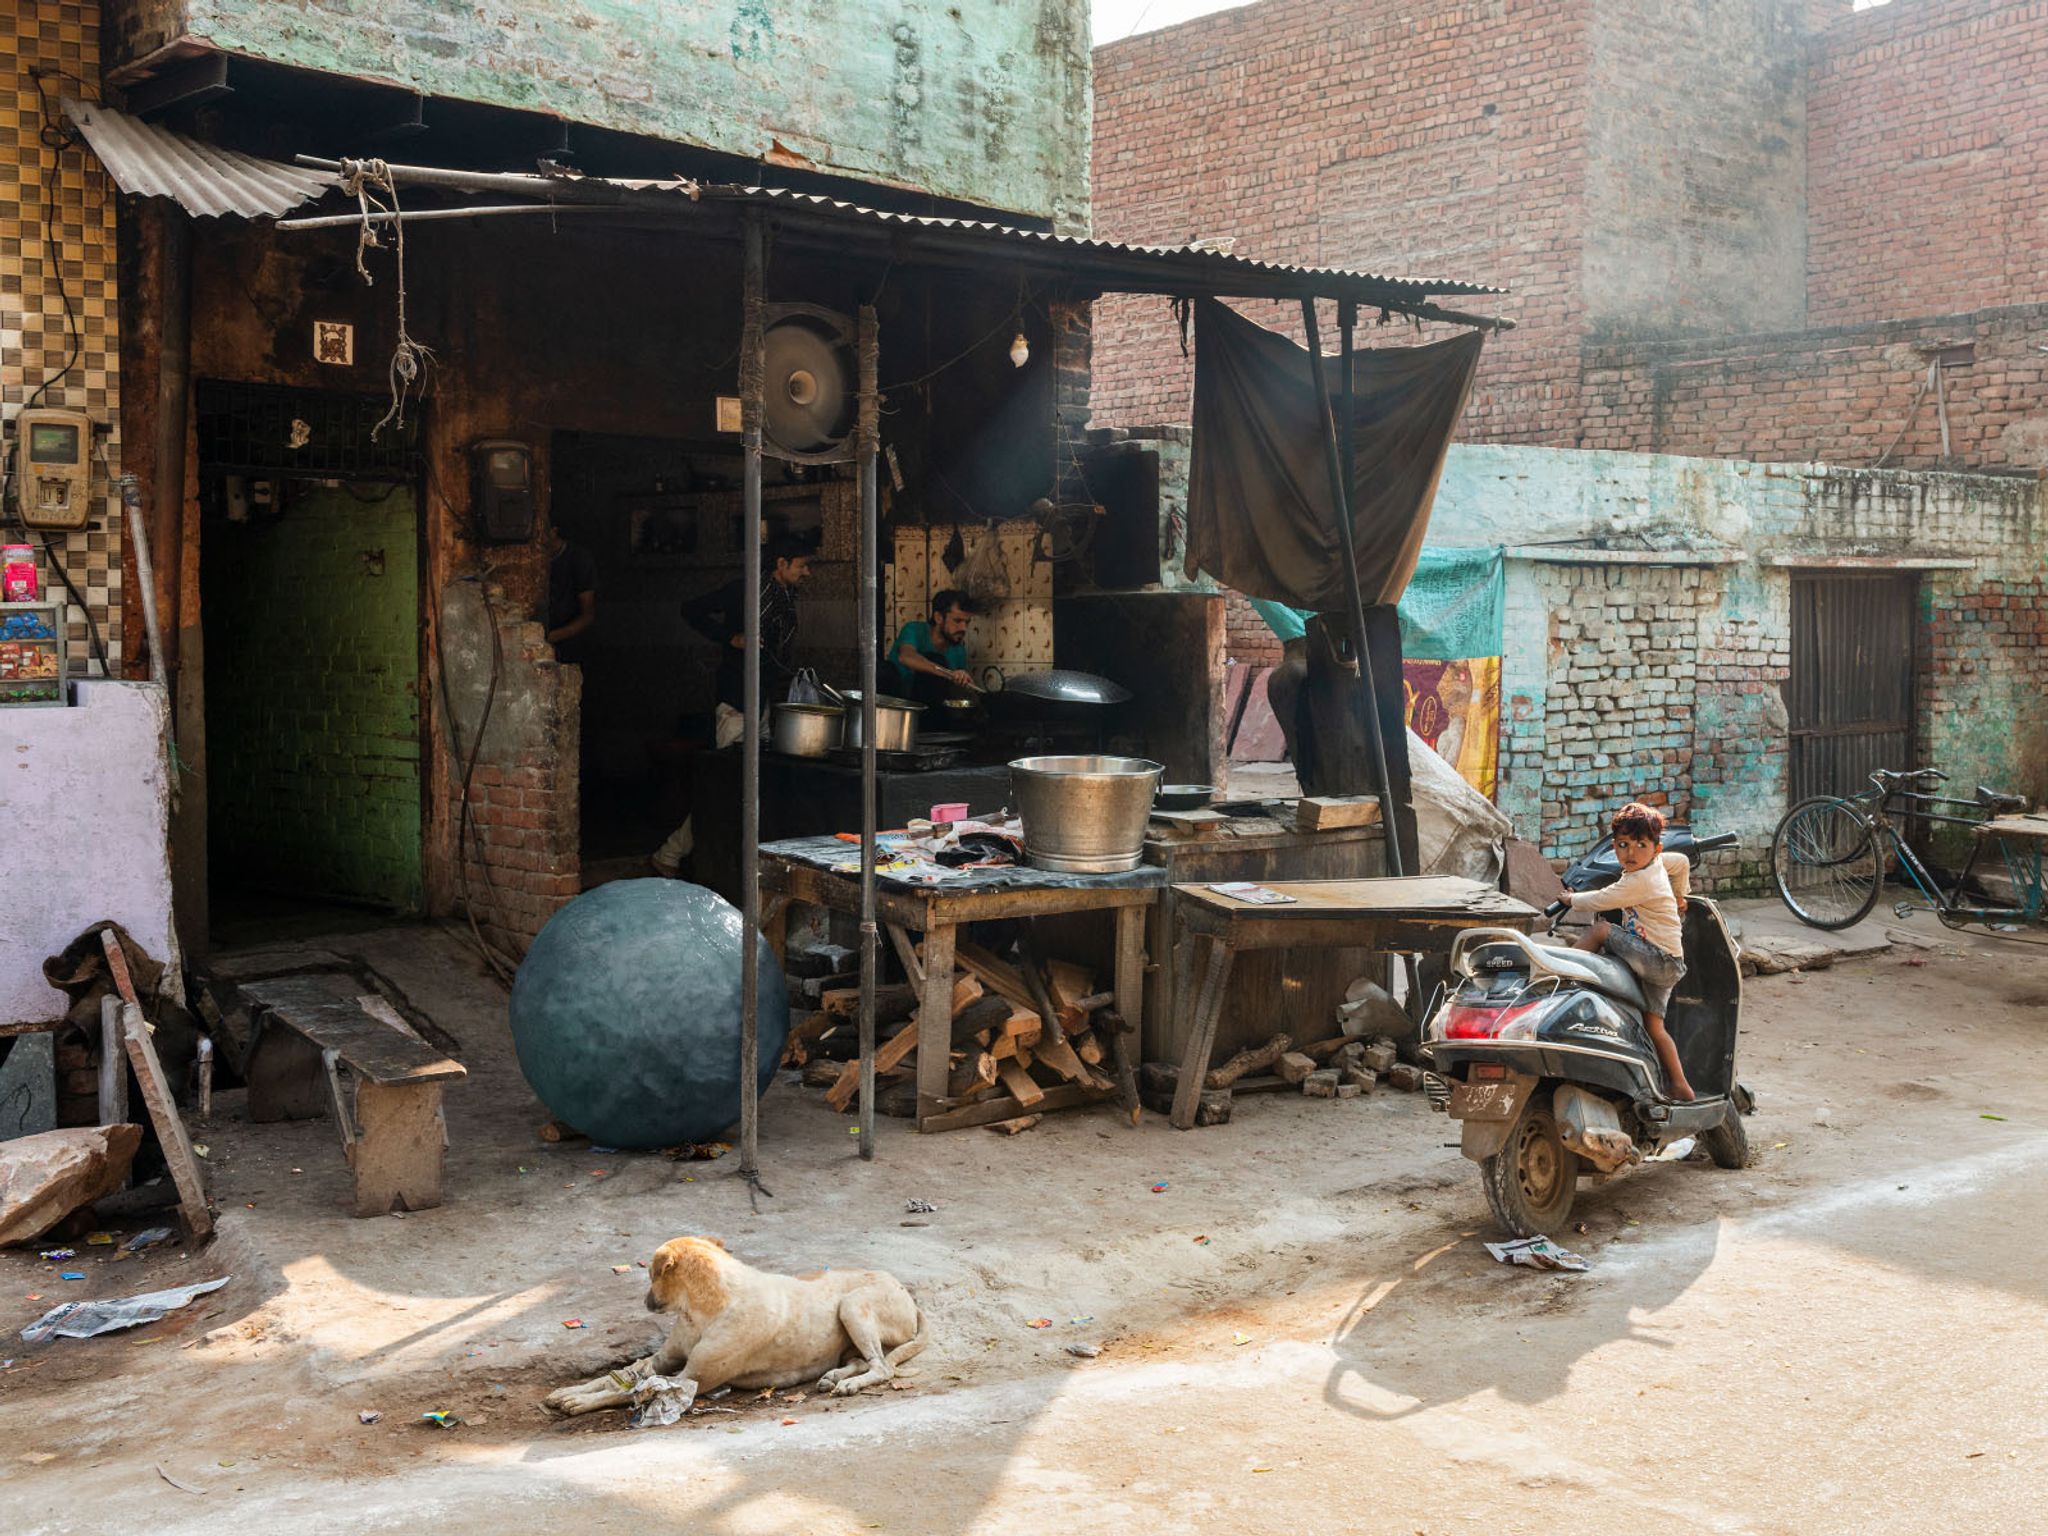
0.24 cubic meters – the average volume of ice lost on Rulung glacier every minute
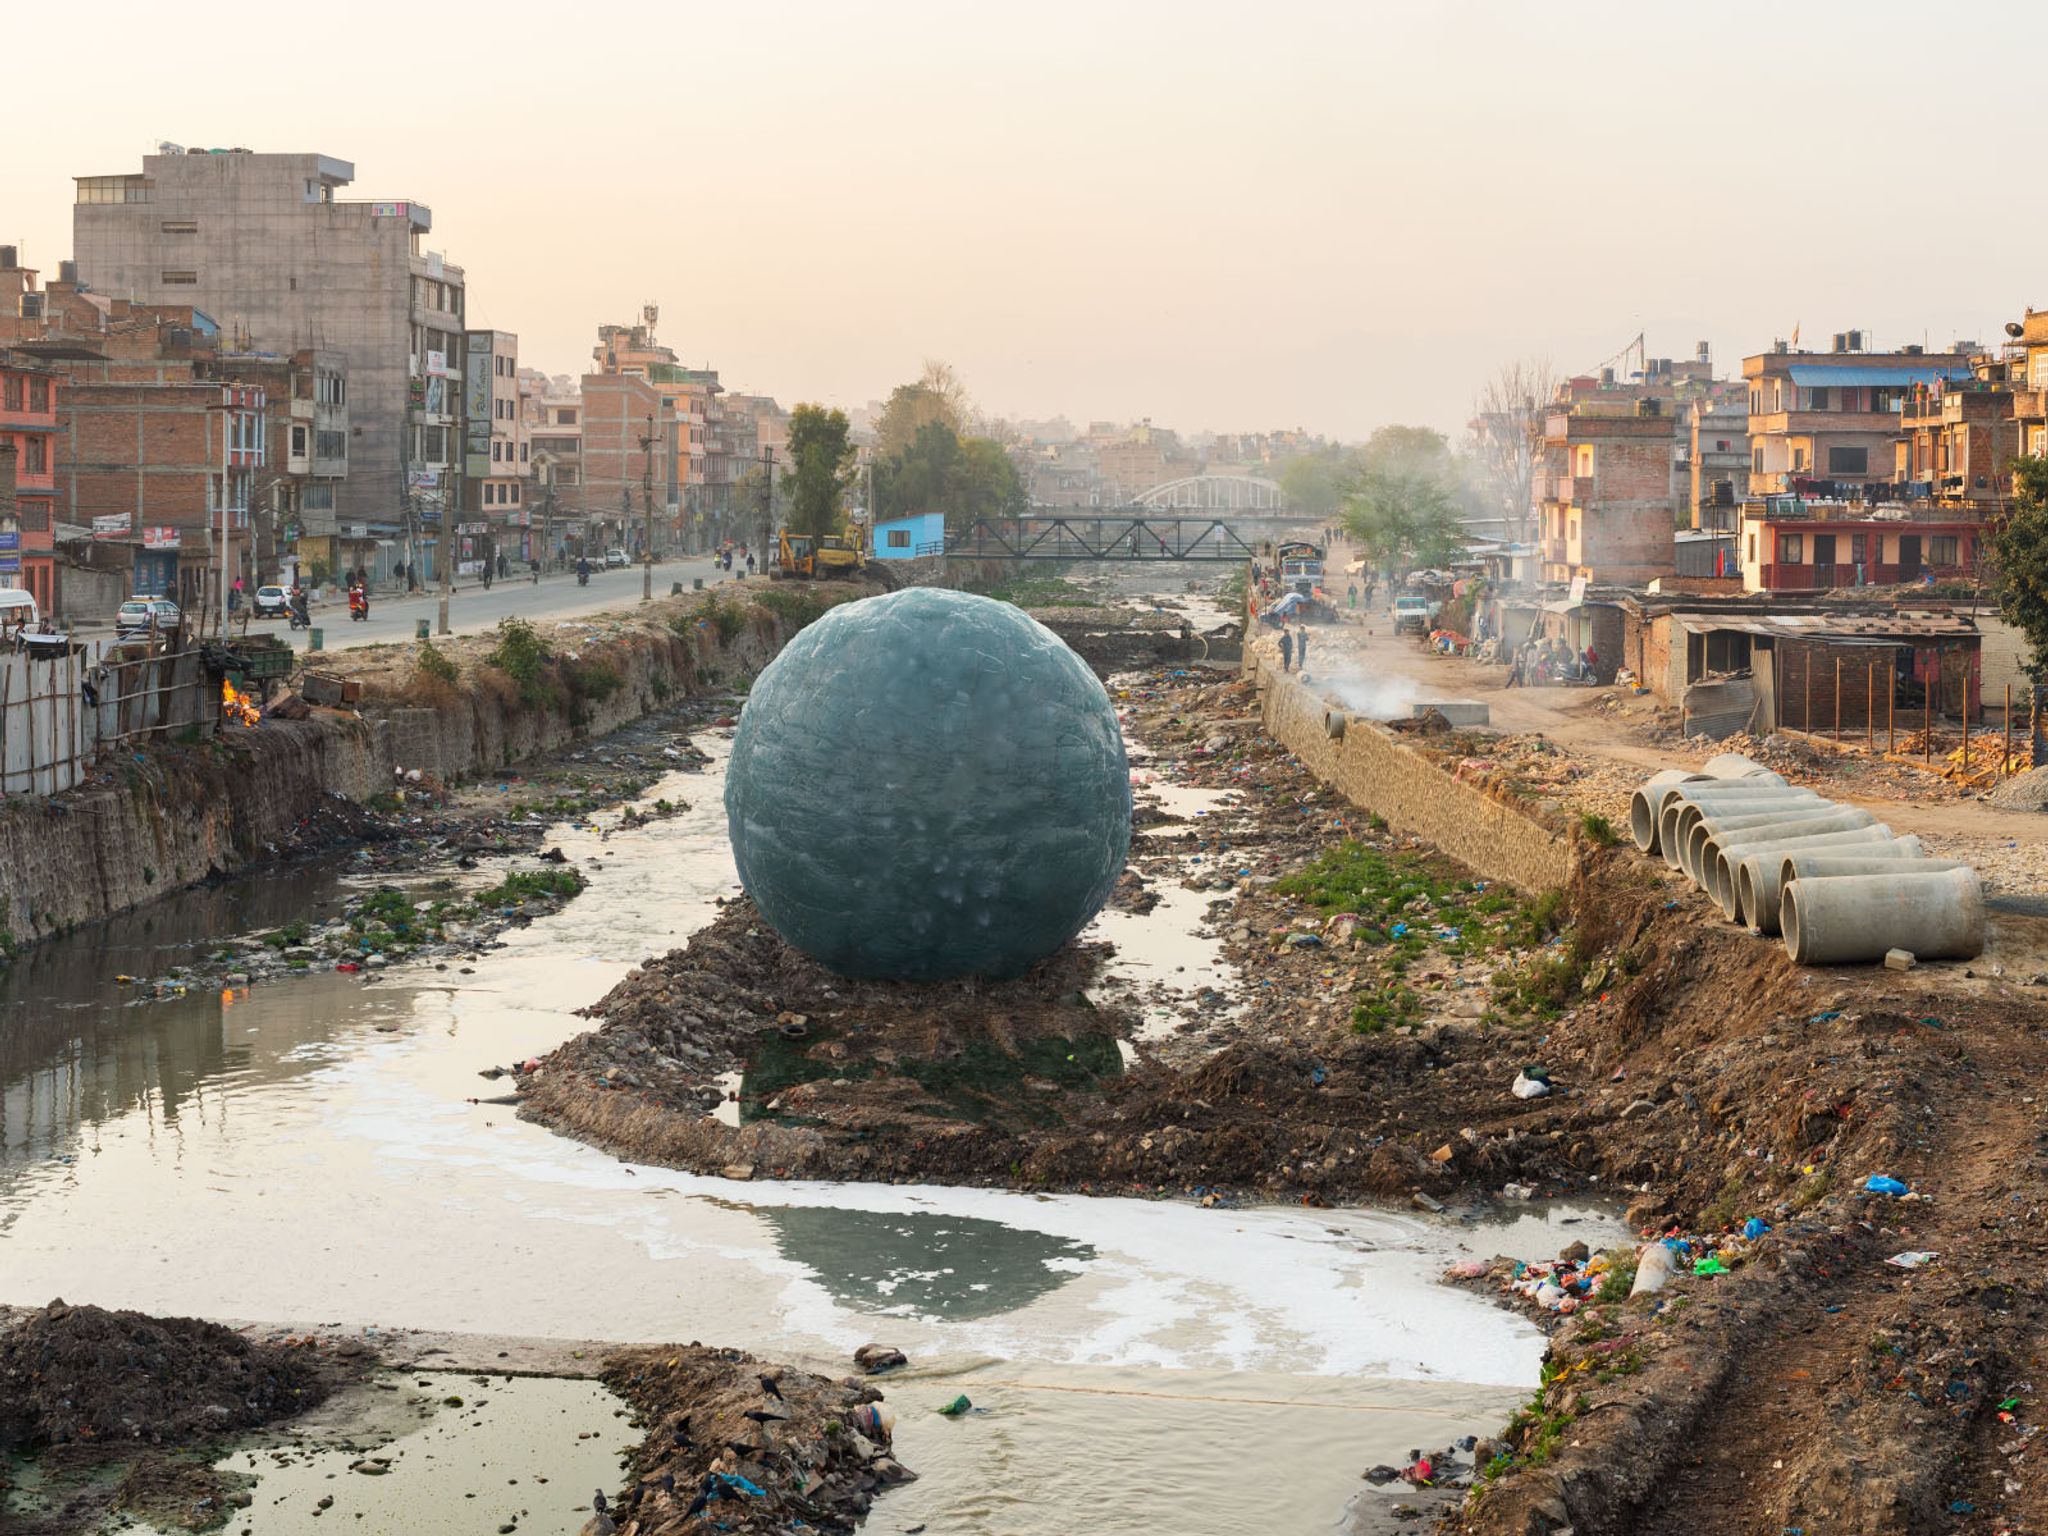
73.01 cubic meters – the average volume of ice lost on Yala glacier every half hour
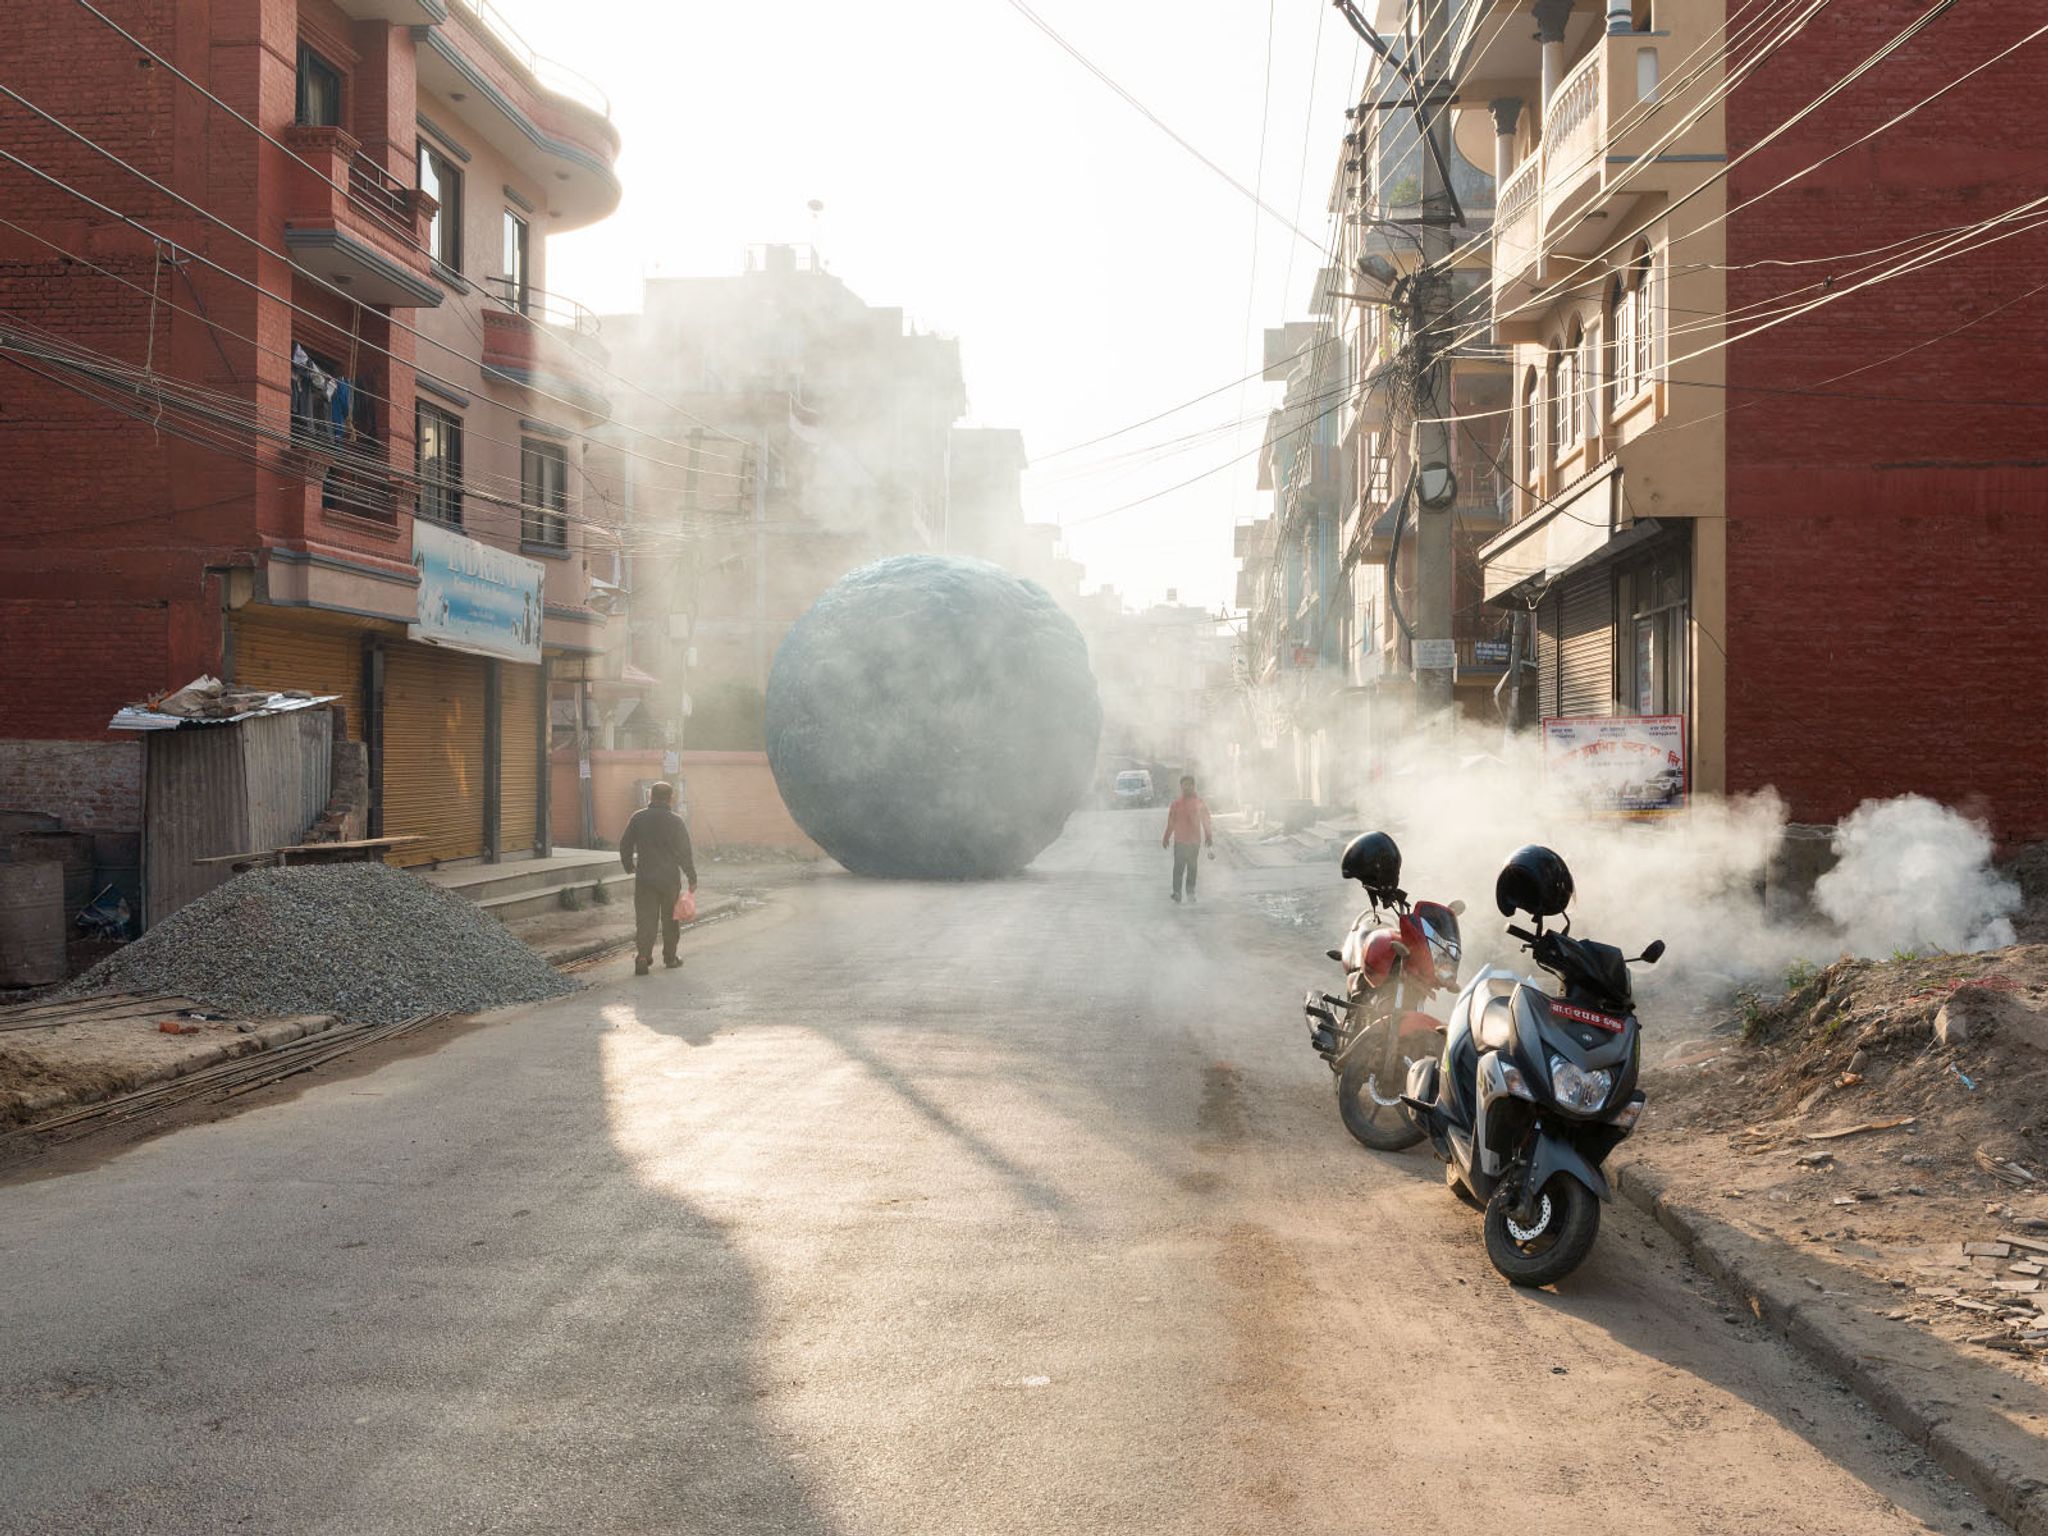
72.47 cubic meters – the average volume of ice lost on West Changri Nup glacier every half hour
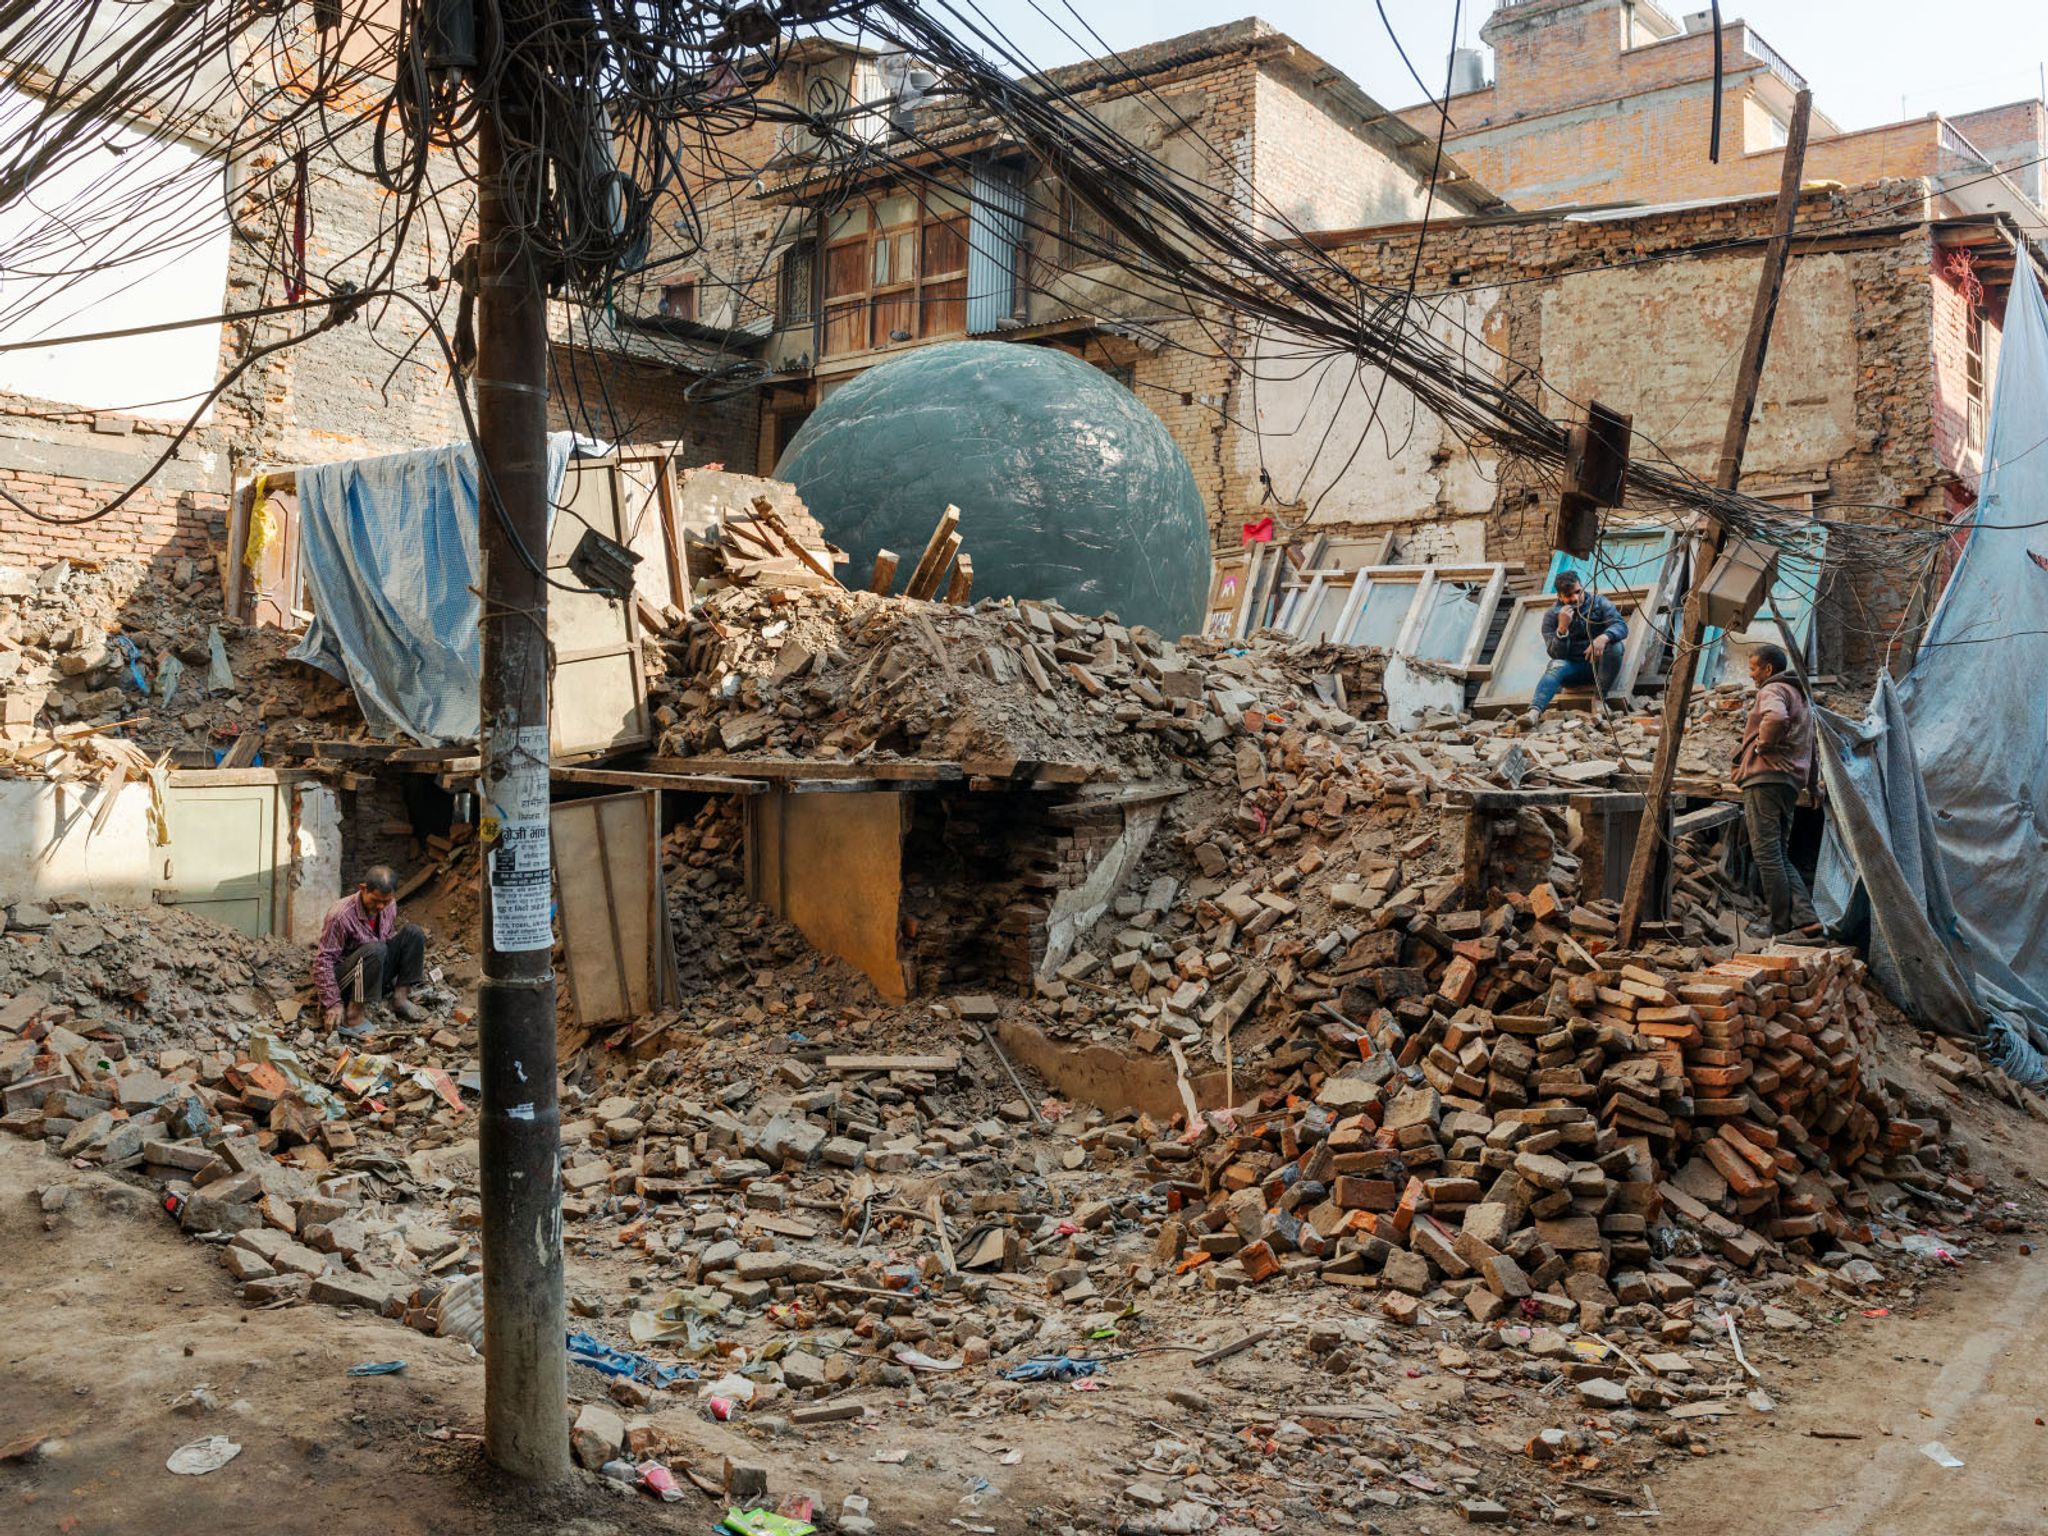
26.26 cubic meters – the average volume of ice lost on Shorang Himal glacier every half hour
13.45 cubic meters – the average volume of ice lost on Mera glacier every hour